Comparison of red-shifted firefly luciferase Ppy RE9 and conventional Luc2 as bioluminescence imaging reporter genes for in vivo imaging of stem cells
- PMID: 22352654
- PMCID: PMC3380811
- DOI: 10.1117/1.JBO.17.1.016004
Comparison of red-shifted firefly luciferase Ppy RE9 and conventional Luc2 as bioluminescence imaging reporter genes for in vivo imaging of stem cells
Abstract
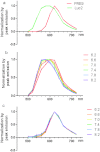
One critical issue for noninvasive imaging of transplanted bioluminescent cells is the large amount of light absorption in tissue when emission wavelengths below 600 nm are used. Luciferase with a red-shifted spectrum can potentially bypass this limitation. We assessed and compared a mutant of firefly luciferase (Ppy RE9, PRE9) against the yellow luciferase luc2 gene for use in cell transplantation studies. C17.2 neural stem cells expressing PRE9-Venus and luc2-Venus were sorted by flow cytometry and assessed for bioluminescence in vitro in culture and in vivo after transplantation into the brain of immunodeficient Rag2-/- mice. We found that the luminescence from PRE9 was stable, with a peak emission at 620 nm, shifted to the red compared to that of luc2. The emission peak for PRE9 was pH-independent, in contrast to luc2, and much less affected by tissue absorbance compared to that of luc2. However, the total emitted light radiance from PRE9 was substantially lower than that of luc2, both in vitro and in vivo. We conclude that PRE9 has favorable properties as compared to luc2 in terms of pH independence, red-shifted spectrum, tissue light penetration, and signal quantification, justifying further optimization of protein expression and enzymatic activity.
Figures


Similar articles
-
Evaluating reporter genes of different luciferases for optimized in vivo bioluminescence imaging of transplanted neural stem cells in the brain.Contrast Media Mol Imaging. 2013 Nov-Dec;8(6):505-13. doi: 10.1002/cmmi.1549. Contrast Media Mol Imaging. 2013. PMID: 24375906
-
Evaluating Brightness and Spectral Properties of Click Beetle and Firefly Luciferases Using Luciferin Analogues: Identification of Preferred Pairings of Luciferase and Substrate for In Vivo Bioluminescence Imaging.Mol Imaging Biol. 2020 Dec;22(6):1523-1531. doi: 10.1007/s11307-020-01523-7. Epub 2020 Sep 14. Mol Imaging Biol. 2020. PMID: 32926287 Free PMC article.
-
A novel luciferase fusion protein for highly sensitive optical imaging: from single-cell analysis to in vivo whole-body bioluminescence imaging.Anal Bioanal Chem. 2014 Sep;406(23):5727-34. doi: 10.1007/s00216-014-7917-2. Epub 2014 Jun 24. Anal Bioanal Chem. 2014. PMID: 24958343 Free PMC article.
-
Bioluminescence Color-Tuning Firefly Luciferases: Engineering and Prospects for Real-Time Intracellular pH Imaging and Heavy Metal Biosensing.Biosensors (Basel). 2022 Jun 10;12(6):400. doi: 10.3390/bios12060400. Biosensors (Basel). 2022. PMID: 35735548 Free PMC article. Review.
-
In vivo bioluminescence for tracking cell fate and function.Am J Physiol Heart Circ Physiol. 2011 Sep;301(3):H663-71. doi: 10.1152/ajpheart.00337.2011. Epub 2011 Jun 10. Am J Physiol Heart Circ Physiol. 2011. PMID: 21666118 Free PMC article. Review.
Cited by
-
In vivo imaging of trypanosome-brain interactions and development of a rapid screening test for drugs against CNS stage trypanosomiasis.PLoS Negl Trop Dis. 2013 Aug 22;7(8):e2384. doi: 10.1371/journal.pntd.0002384. eCollection 2013. PLoS Negl Trop Dis. 2013. PMID: 23991236 Free PMC article.
-
Methionyl-tRNA synthetase inhibitor has potent in vivo activity in a novel Giardia lamblia luciferase murine infection model.J Antimicrob Chemother. 2020 May 1;75(5):1218-1227. doi: 10.1093/jac/dkz567. J Antimicrob Chemother. 2020. PMID: 32011682 Free PMC article.
-
Development of two mouse strains conditionally expressing bright luciferases with distinct emission spectra as new tools for in vivo imaging.Lab Anim (NY). 2023 Oct;52(10):247-257. doi: 10.1038/s41684-023-01238-6. Epub 2023 Sep 7. Lab Anim (NY). 2023. PMID: 37679611 Free PMC article.
-
A review of novel optical imaging strategies of the stroke pathology and stem cell therapy in stroke.Front Cell Neurosci. 2014 Aug 14;8:226. doi: 10.3389/fncel.2014.00226. eCollection 2014. Front Cell Neurosci. 2014. PMID: 25177269 Free PMC article. Review.
-
Imaging Adenosine Triphosphate (ATP).Biol Bull. 2016 Aug;231(1):73-84. doi: 10.1086/689592. Biol Bull. 2016. PMID: 27638696 Free PMC article. Review.

