. 2012 Mar 28;60(12):3223-33.
doi: 10.1021/jf201987k. Epub 2012 Mar 15.

Systematic studies of sulfation and glucuronidation of 12 flavonoids in the mouse liver S9 fraction reveal both unique and shared positional preferences

Affiliations

Systematic studies of sulfation and glucuronidation of 12 flavonoids in the mouse liver S9 fraction reveal both unique and shared positional preferences

Lan Tang et al. J Agric Food Chem. .

Abstract

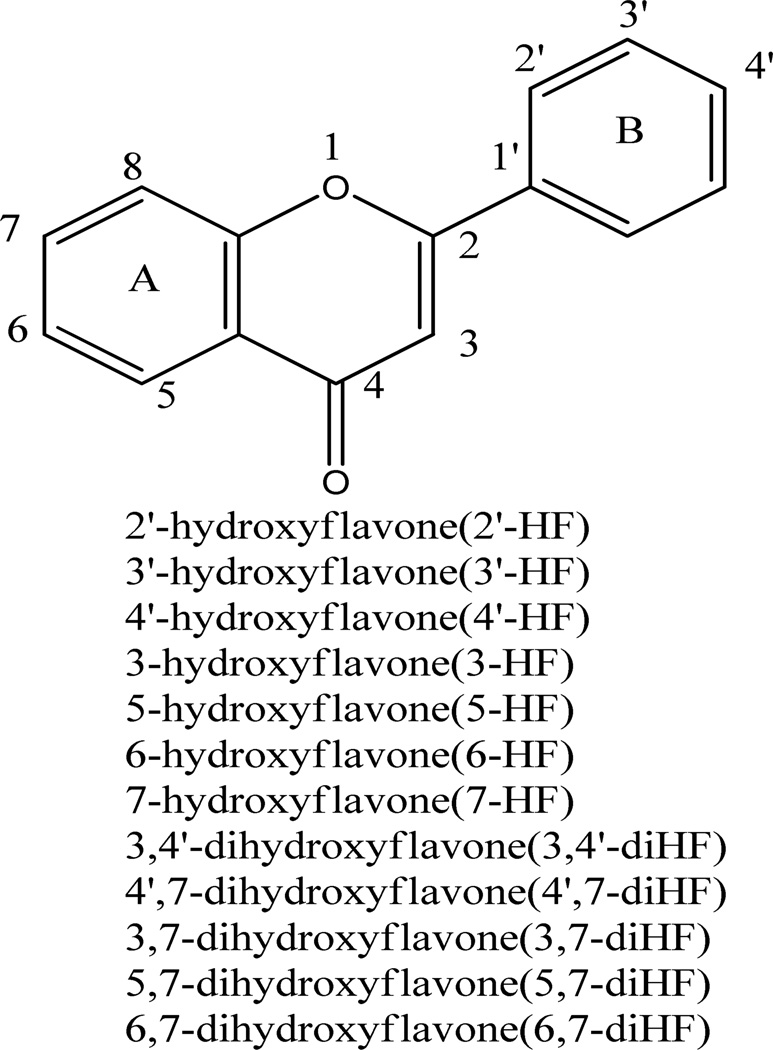
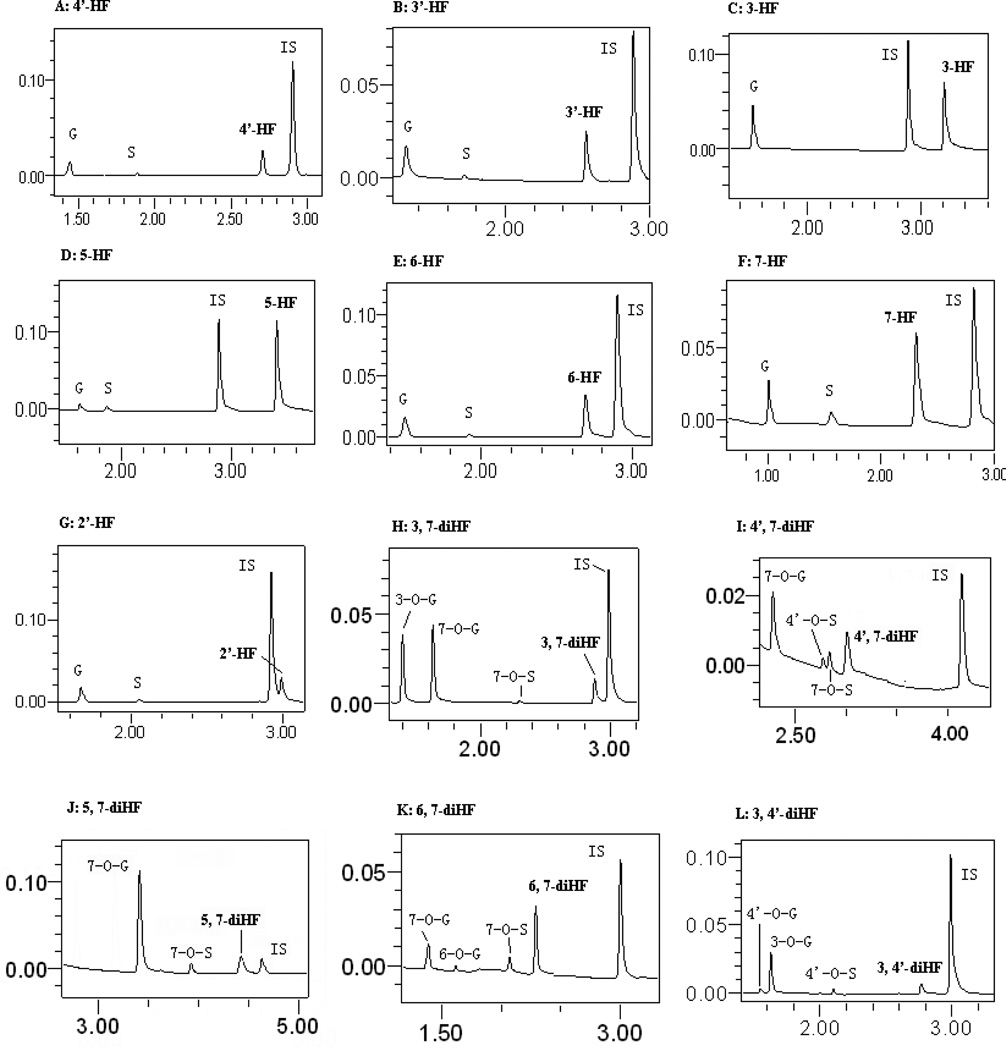
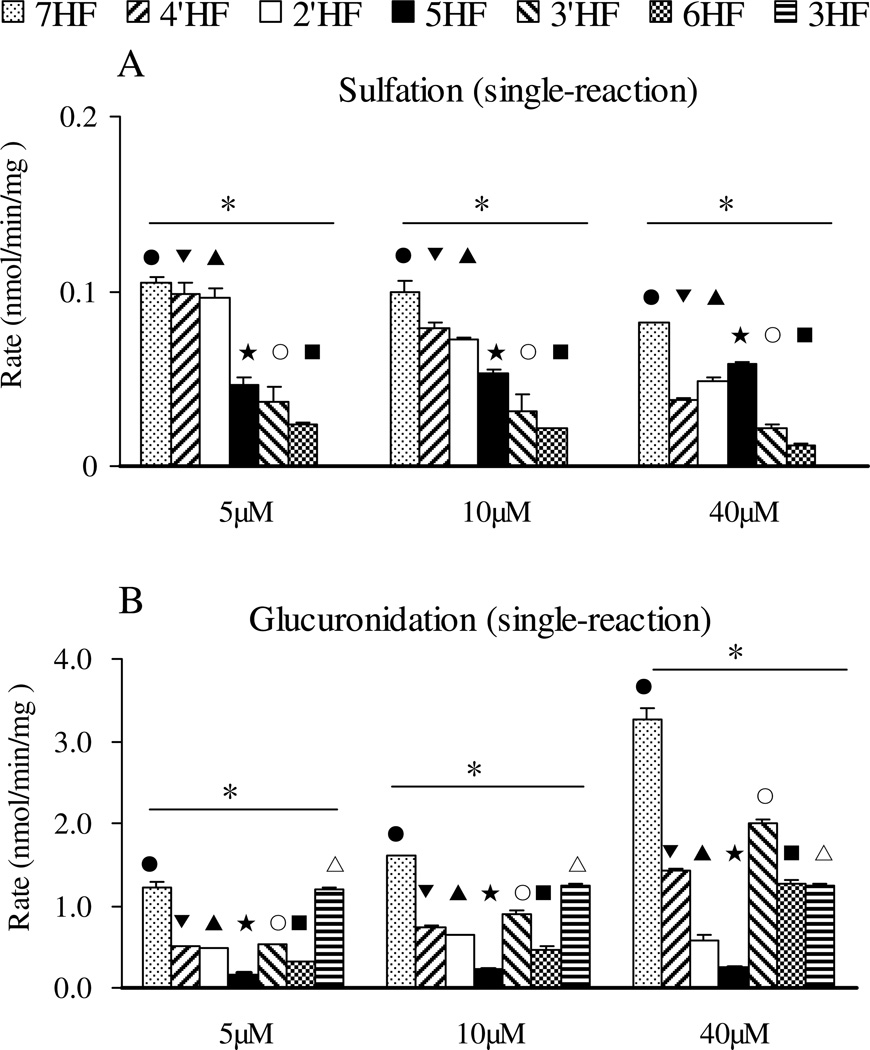
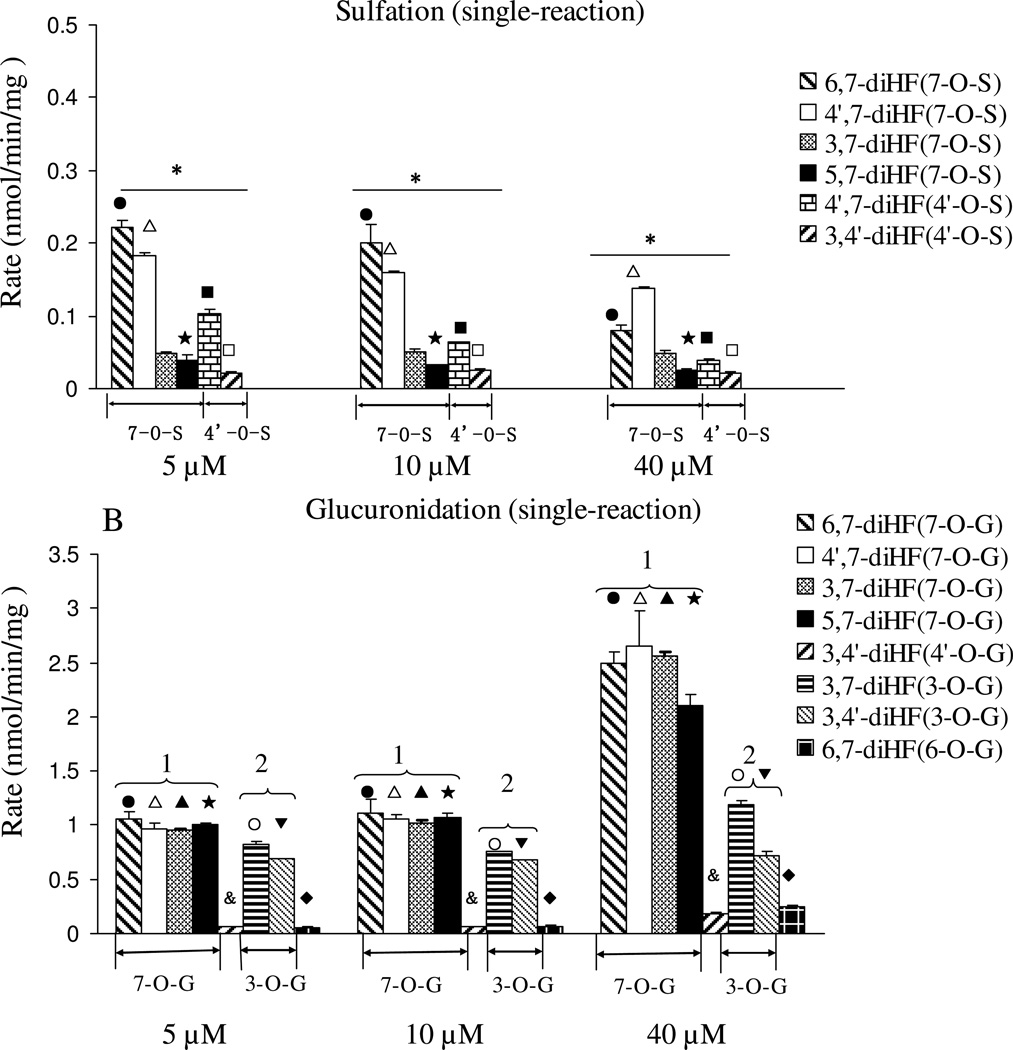
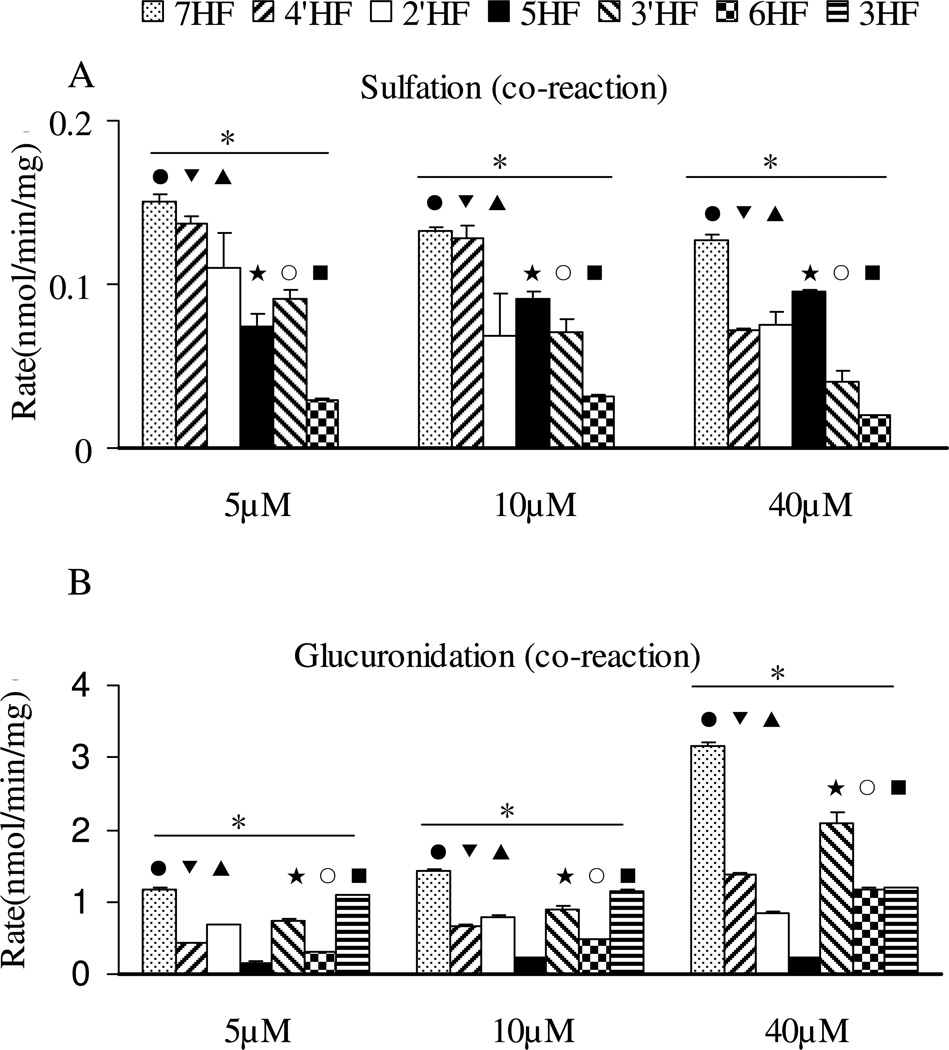
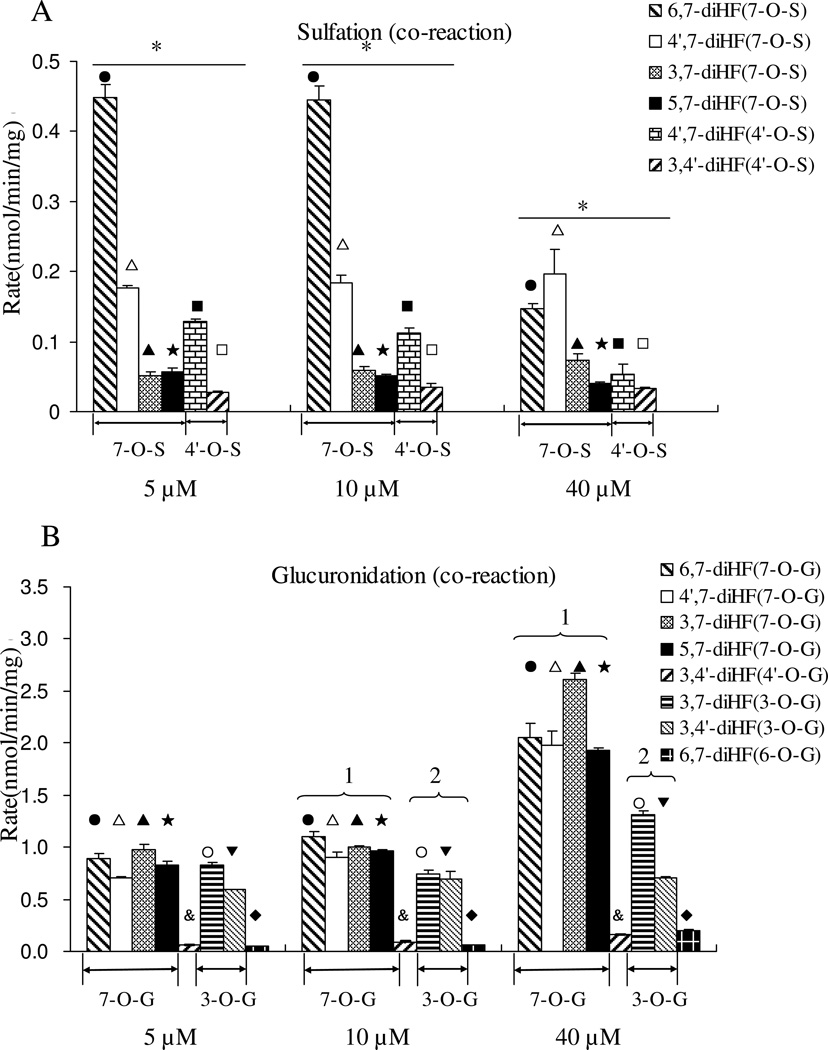
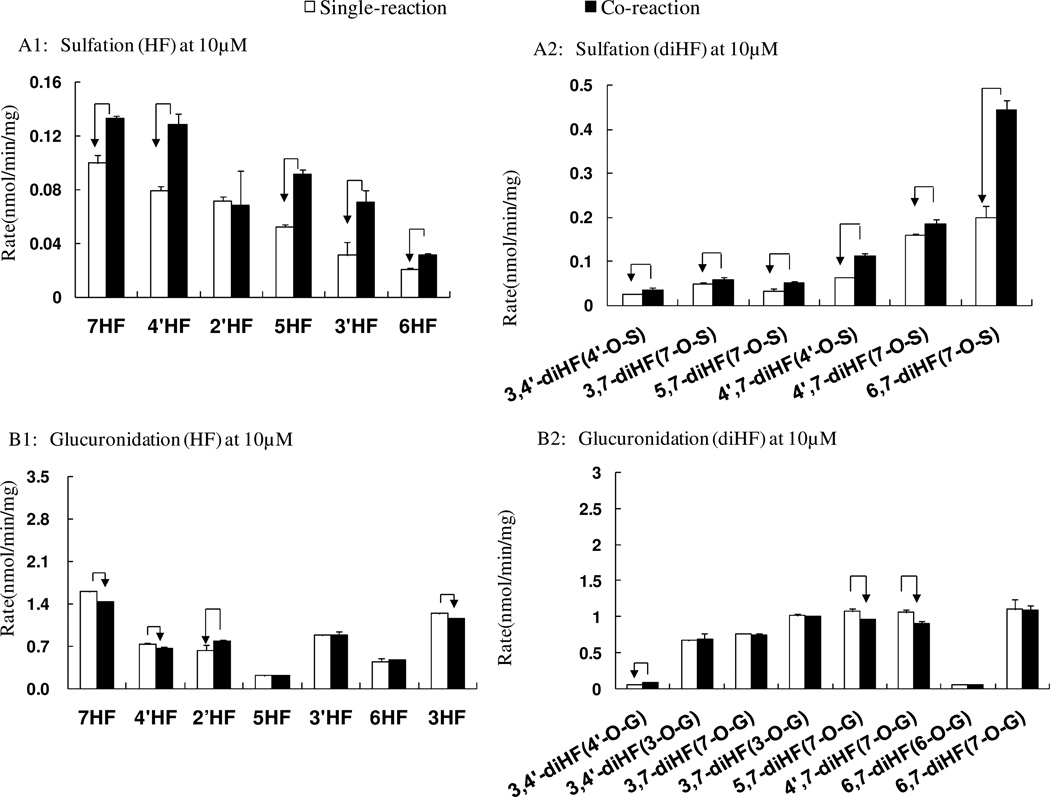
Sulfation and glucuronidation are the principal metabolic pathways of flavonoids, and extensive phase II metabolism is the main reason for their poor bioavailabilities. The purpose of this study was to compare the similarities and differences in the positional preference of glucuronidation versus sulfation in the mouse liver S9 fraction. The conjugating rates of seven monohydroxyflavones (HFs) (i.e., 2'-, 3'-, 4'-, 3-, 5-, 6-, and 7-HF), and five dihydroxyflavones (diHFs) (i.e., 6,7-, 4',7-, 3,7-, 5,7-, and 3,4'-diHF) were determined in three separate enzymatic reaction systems: (A) sulfation only, (B) glucuronidation only, or (C) simultaneous sulfation and glucuronidation (i.e., Sult-Ugt coreaction). In general, glucuronidation rates were much faster than sulfation rates. Among the HFs, 7-HF was the best substrate for both conjugation reactions, whereas 3-HF was rapidly glucuronidated but was not sulfated. As a result, the rank order of sulfation was very different from that of glucuronidation. Among the diHFs, regiospecific glucuronidation was limited to 7-OH and 3-OH positions, whereas regiospecific sulfation was limited to 7-OH and 4'-OH positions. Other positions (i.e., 6-OH and 5-OH) in diHFs were not conjugated. The positional preferences were essentially maintained in a Sult-Ugt coreaction system, although sulfation was surprisingly enhanced. Lastly, sulfation and glucuronidation displayed different regiospecific- and substrate-dependent characteristics. In conclusion, glucuronidation and sulfation shared the same preference for 7-OH position (of flavonoids) but displayed unique preference in other positions in that glucuronidation preferred the 3-OH position whereas sulfation preferred the 4'-OH position.


Figures

Figure 1
Figure 1. Structures of model flavones
Structures of aglycone forms of tested flavones used in the present study. Seven monohydroxyflavones and five dihydroxyflavones were chosen for these experiments. Available conjugating –OH positions include 3, 5, 6, 7, 2’, 3’, and 4’.
Figure 2
Figure 2. UPLC chromatograms of HFs and di-HFs, and their phase II metabolites in Sult- and Ugt-associated reactions
The UPLC chromatograms were used to quantify the flavones and their respective metabolites, which were obtained after incubation of flavones with the FVB mouse liver S9 fraction.
Figure 3
Figure 3. Glucuronidation and sulfation of seven mono-hydroxyflavones in single Sult or Ugt reaction system
Three different concentrations (5, 10, and 40 µM) were used in the experiments done in triplicates (n=3). The rates of glucuronidation and sulfation were calculated in nmol/min/mg protein. The error bar is the SD of three determinations. The data were analyzed by one-way ANOVA with Tukey post-hoc test. The asterisk (*) indicates a statistically significant difference for the glucuronidation (Figure 3A) and sulfation (Figure 3B) rates among seven mono-hydroxyflavones (p< 0.05, one-way ANOVA). Significant differences between three concentrations for each flavone are marked as follows: ●P<0.05 for 7-HF, ▼P<0.05 for 4’-HF, ▲P<0.05 for 2’-HF, □P<0.05 for 5-HF, ○P<0.05 for 3’-HF, ■P<0.05 for 6-HF, □P<0.05 for 3-HF.
Figure 4
Figure 4. Glucuronidation and sulfation of five dihydroxyflavones by FVB mice liver S9 in a single Sult (A) and Ugt (B) reaction system
Concentrations used, number of experiments and calculation of the rates of glucuronidation and sulfation are the same as in the legend to Figure 3. The data were analyzed by one-way ANOVA with Tukey post-hoc test (Figure 4A) or Univariate ANOVA with Tukey test (Figure 4B). The asterisk (*) in Figure 4A indicates a statistically significant difference in the sulfation rates among five diHFs (p < 0.05, one way ANOVA). The number “1” in Figure 4B, shows that 7-OH position is the group of reaction with the fastest glucuronidation rates, and the number “2” shows the –OH group with the second fastest glucuronidation rates at 3-OH. Significant differences between three concentrations for each flavone are marked as follows: ●P<0.05 for 6, 7-diHF (7-O-S or 7-O-G), □P<0.05 for 4’, 7-diHF(7-O-S or 7-O-G), ▲P<0.05 for 3, 7-diHF (7-O-G), □P<0.05 for 5, 7-diHF (7-O-S or 7-O-G), ■P<0.05 for 4’, 7-diHF (4’-O-S), □P<0.05 for 3, 4’-diHF (4’-O-S), &P<0.05 for 3, 4’-diHF (4’-O-G), ○P<0.05 for 3, 7-diHF (3-O-G), ▼P<0.05 for 3, 4’-diHF (3-O-G)6-HF, ♦P<0.05 for 6, 7-diHF (6-O-G)
Figure 5
Figure 5. Glucuronidation and sulfation of seven mono-hydroxyflavones in Sult-Ugt co-reaction system
Concentrations used, number of experiments, calculation of the rates of glucuronidation and sulfation, and data analysis, are the same as in the legend to Figure 3. The asterisk (*) indicates a statistically significant difference for the glucuronidation and sulfation rates among seven mono-hydroxyflavones (p< 0.05, one way ANOVA). Significant differences between three concentrations for each flavone are the same as in the legend to Figure 3.
Figure 6
Figure 6. Glucuronidation and sulfation of five dihydroxyflavones by FVB mice liver S9 in a Sult-Ugt co-reaction system
Concentrations used, number of experiments, and calculation of the rates of glucuronidation and sulfation are the same as in the legend to Figure 3. The data were analyzed by one-way ANOVA with Tukey post-hoc test (Figure 6A) or Univariate ANOVA with Tukey test (Figure 6B). The asterisk (*) in Figure 6A indicates a statistically significant difference for the sulfation rates among five dihydroxyflavones (p < 0.05). Number “1” and the number “2” are the same as in the legend to Figure 4. Significant differences between three concentrations for each flavone are the same as in the legend to Figure 4.
Figure 7
Figure 7. Interaction between sulfation and glucuronidation for hydroxyflavones in a Sult and Ugt co-reaction system
Concentration of 10 µM was shown. Sulfation in the Sult single reaction system and the Sult-Ugt co-reaction system were compared (A1, A2). Glucuronidation in the single Ugt reaction system and the Sult-Ugt co-reaction system were also compared (B1–B2). The data were analyzed by Student’s t-test. The arrow indicates a statistically significant difference (p < 0.05).

Similar articles

Cited by

References

    1. Thomasset SC, Berry DP, Garcea G, Marczylo T, Steward WP, Gescher AJ. Dietary polyphenolic phytochemicals--promising cancer chemopreventive agents in humans? A review of their clinical properties. Int J Cancer. 2007;120(3):451–458. - PubMed
    1. Benavente-Garcia O, Castillo J. Update on uses and properties of citrus flavonoids: new findings in anticancer, cardiovascular, and anti-inflammatory activity. J Agric Food Chem. 2008;56(15):6185–6205. - PubMed
    1. Birt DF, Hendrich S, Wang W. Dietary agents in cancer prevention: flavonoids and isoflavonoids. Pharmacol Ther. 2001;90(2–3):157–177. - PubMed
    1. Moon JH, Nakata R, Oshima S, Inakuma T, Terao J. Accumulation of quercetin conjugates in blood plasma after the short-term ingestion of onion by women. Am J Physiol Regul Integr Comp Physiol. 2000;279(2):R461–R467. - PubMed
    1. de Vries JH, Hollman PC, Meyboom S, Buysman MN, Zock PL, van Staveren WA, Katan MB. Plasma concentrations and urinary excretion of the antioxidant flavonols quercetin and kaempferol as biomarkers for dietary intake. Am J Clin Nutr. 1998;68(1):60–65. - PubMed

Publication types