

Forecasts of COPD mortality in Australia: 2006-2025
- PMID: 22353210
- PMCID: PMC3355029
- DOI: 10.1186/1471-2288-12-17
Forecasts of COPD mortality in Australia: 2006-2025
Abstract
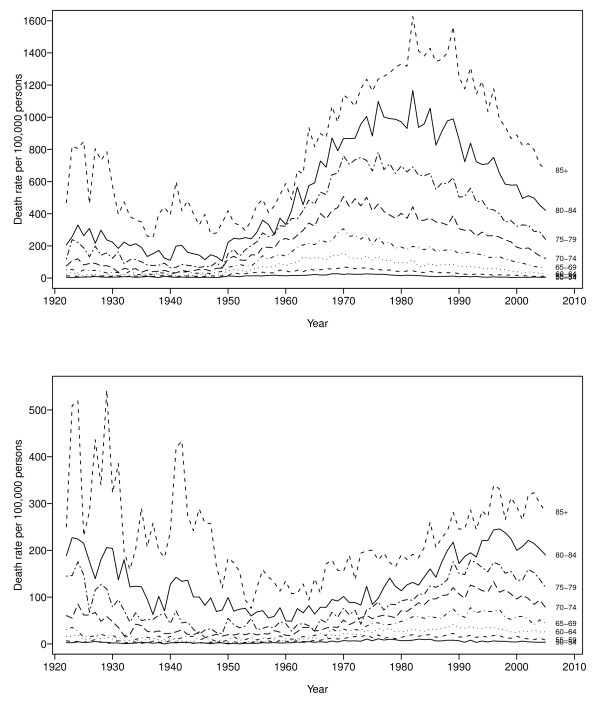
Background: Chronic Obstructive Pulmonary Disease (COPD) is currently the fifth leading cause of death in Australia, and there are marked differences in mortality trends between men and women. In this study, we have sought to model and forecast age related changes in COPD mortality over time for men and women separately over the period 2006-2025.
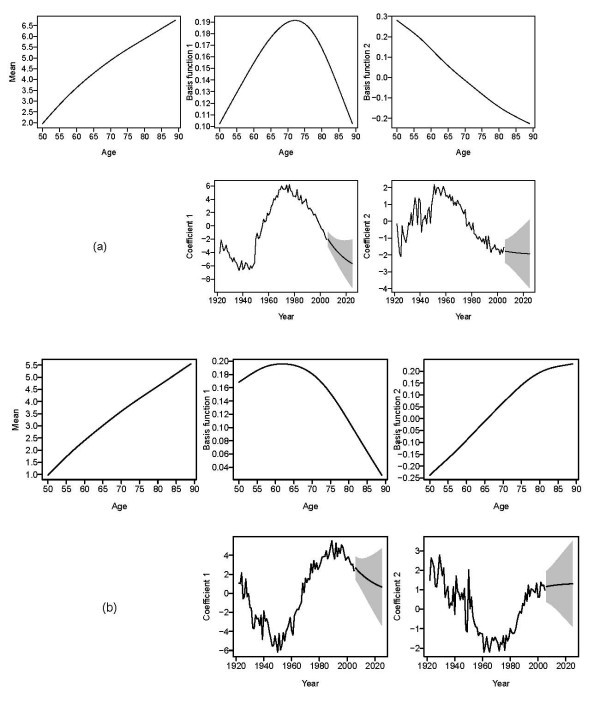
Methods: Annual COPD death rates in Australia from 1922 to 2005 for age groups (50-54, 55-59, 60-64, 65-69, 70-74, 75-79, 80-84, 85+) were used. Functional time series models of age-specific COPD mortality rates for men and women were used, and forecasts of mortality rates were modelled separately for men and women.
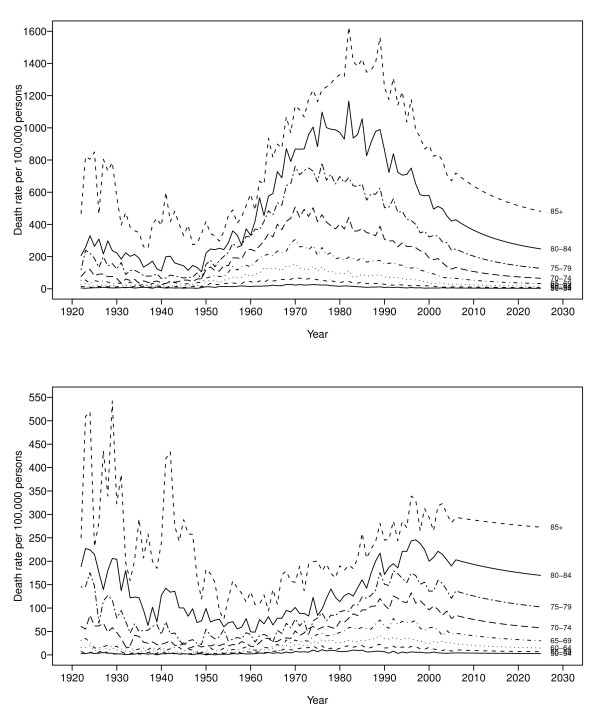
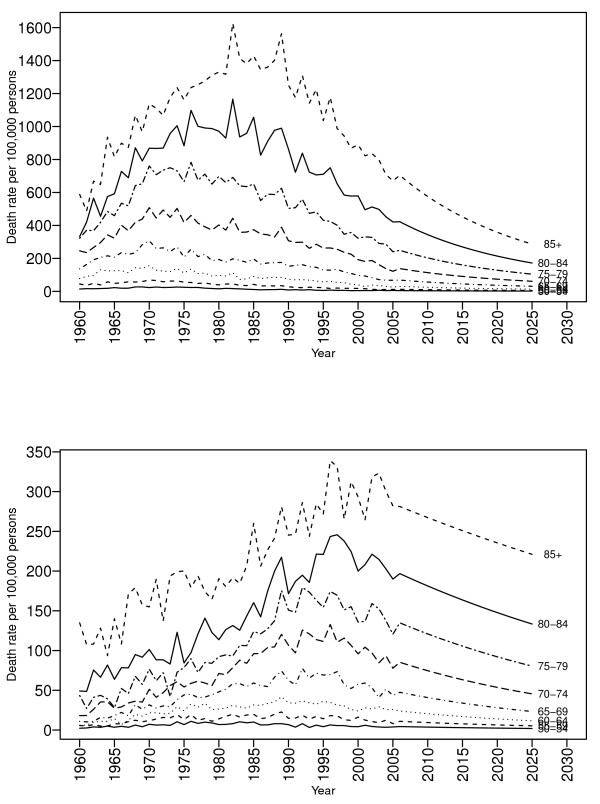
Results: Functional time series models with four basis functions were fitted to each population separately. Twenty-year forecasts were computed, and indicated an overall decline. This decline may be slower for women than for men. By age, we expect similar rates of decline in men over time. In contrast, for women, forecasts for the age group 75-79 years suggest less of a decline over time compared to younger age groups.
Conclusions: By using a new method to predict age-specific trends in COPD mortality over time, this study provides important insights into at-risk age groups for men and women separately, which has implications for policy and program development.
Figures
References
-
- Australian Government Institute of Health and Welfare. Australia's Health 2008. 2008. http://www.aihw.gov.au/publications/index.cfm/title/10585 [updated 2008; cited 13/10/2009]. Available from.
-
- Wilson DH, Tucker G, Frith P, Appleton S, Ruffin RE, Adams RJ. Trends in hospital admissions and mortality from asthma and chronic obstructive pulmonary disease in Australia, 1993-2003. Med J Aust. 2007;86(8):408–411. - PubMed
-
- Hyndman RJ, Ullah MS. Robust forecasting of mortality and fertility rates: a functional data approach. Comput Stat Data Anal. 2007;51(10):4942–4956. doi: 10.1016/j.csda.2006.07.028. - DOI
-
- Australian Government Institute of Health and Welfare. General Record of Incidence of Mortality (GRIM) Books. 2005. http://www.aihw.gov.au/mortality/data/grim_books_national.cfm [updated 2005; cited 13/10/2009]. Available from.
-
- Taylor E. New international disease classification. Health Rep. 1992;4(3):331. - PubMed
MeSH terms
LinkOut - more resources
Full Text Sources
Medical
