Cellular force microscopy for in vivo measurements of plant tissue mechanics
- PMID: 22353572
- PMCID: PMC3343728
- DOI: 10.1104/pp.111.191460
Cellular force microscopy for in vivo measurements of plant tissue mechanics
Abstract
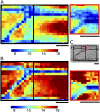
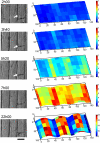
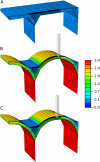
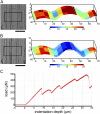
Although growth and morphogenesis are controlled by genetics, physical shape change in plant tissue results from a balance between cell wall loosening and intracellular pressure. Despite recent work demonstrating a role for mechanical signals in morphogenesis, precise measurement of mechanical properties at the individual cell level remains a technical challenge. To address this challenge, we have developed cellular force microscopy (CFM), which combines the versatility of classical microindentation techniques with the high automation and resolution approaching that of atomic force microscopy. CFM's large range of forces provides the possibility to map the apparent stiffness of both plasmolyzed and turgid tissue as well as to perform micropuncture of cells using very high stresses. CFM experiments reveal that, within a tissue, local stiffness measurements can vary with the level of turgor pressure in an unexpected way. Altogether, our results highlight the importance of detailed physically based simulations for the interpretation of microindentation results. CFM's ability to be used both to assess and manipulate tissue mechanics makes it a method of choice to unravel the feedbacks between mechanics, genetics, and morphogenesis.
Figures


Similar articles
-
Cellular Force Microscopy to Measure Mechanical Forces in Plant Cells.Methods Mol Biol. 2019;1992:215-230. doi: 10.1007/978-1-4939-9469-4_14. Methods Mol Biol. 2019. PMID: 31148041
-
Use of Atomic Force Microscopy to Measure Mechanical Properties and Turgor Pressure of Plant Cells and Plant Tissues.J Vis Exp. 2019 Jul 15;(149). doi: 10.3791/59674. J Vis Exp. 2019. PMID: 31355790
-
Measuring the mechanical properties of plant cells by combining micro-indentation with osmotic treatments.J Exp Bot. 2015 Jun;66(11):3229-41. doi: 10.1093/jxb/erv135. Epub 2015 Apr 7. J Exp Bot. 2015. PMID: 25873663 Free PMC article.
-
Getting into shape: the mechanics behind plant morphogenesis.Curr Opin Plant Biol. 2018 Dec;46:25-31. doi: 10.1016/j.pbi.2018.07.002. Epub 2018 Jul 20. Curr Opin Plant Biol. 2018. PMID: 30036706 Review.
-
Shrinking the hammer: micromechanical approaches to morphogenesis.J Exp Bot. 2013 Nov;64(15):4651-62. doi: 10.1093/jxb/ert169. Epub 2013 Jul 19. J Exp Bot. 2013. PMID: 23873995 Review.
Cited by
-
The importance of being edgy: cell geometric edges as an emerging polar domain in plant cells.J Microsc. 2020 Jun;278(3):123-131. doi: 10.1111/jmi.12847. Epub 2019 Nov 28. J Microsc. 2020. PMID: 31755561 Free PMC article. Review.
-
Morphomechanical Innovation Drives Explosive Seed Dispersal.Cell. 2016 Jun 30;166(1):222-33. doi: 10.1016/j.cell.2016.05.002. Epub 2016 Jun 2. Cell. 2016. PMID: 27264605 Free PMC article.
-
Post-Turing tissue pattern formation: Advent of mechanochemistry.PLoS Comput Biol. 2018 Jul 3;14(7):e1006259. doi: 10.1371/journal.pcbi.1006259. eCollection 2018 Jul. PLoS Comput Biol. 2018. PMID: 29969460 Free PMC article.
-
Force microscopy of the Caenorhabditis elegans embryonic eggshell.Microsyst Nanoeng. 2020 May 4;6:29. doi: 10.1038/s41378-020-0137-3. eCollection 2020. Microsyst Nanoeng. 2020. PMID: 32382445 Free PMC article.
-
The stiffening of the cell walls observed during physiological softening of pears.Planta. 2016 Feb;243(2):519-29. doi: 10.1007/s00425-015-2423-0. Epub 2015 Oct 26. Planta. 2016. PMID: 26498014 Free PMC article.
References
-
- Baskin TI. (2005) Anisotropic expansion of the plant cell wall. Annu Rev Cell Dev Biol 21: 203–222 - PubMed
-
- Blewett J, Burrows K, Thomas CA. (2000) Micromanipulation method to measure the mechanical properties of single tomato suspension cells. Biotechnol Lett 22: 1877–1883
-
- Bolduc JE, Lewis LJ, Aubin CE, Geitmann A. (2006) Finite-element analysis of geometrical factors in micro-indentation of pollen tubes. Biomech Model Mechanobiol 5: 227–236 - PubMed
-
- Burgert I. (2006) Exploring the micromechanical design of plant cell walls. Am J Bot 93: 1391–1401 - PubMed
-
- Cappella B, Dietler G. (1999) Force-distance curves by atomic force microscopy. Surf Sci Rep 34: 5–104
Publication types
MeSH terms
LinkOut - more resources
Full Text Sources
Other Literature Sources

