Review
. 2012 May 17;119(20):4587-96.
doi: 10.1182/blood-2011-02-272682. Epub 2012 Feb 21.

Silent cerebral infarcts: a review on a prevalent and progressive cause of neurologic injury in sickle cell anemia

Affiliations
Review

Silent cerebral infarcts: a review on a prevalent and progressive cause of neurologic injury in sickle cell anemia

Michael R DeBaun et al. Blood. .

Abstract

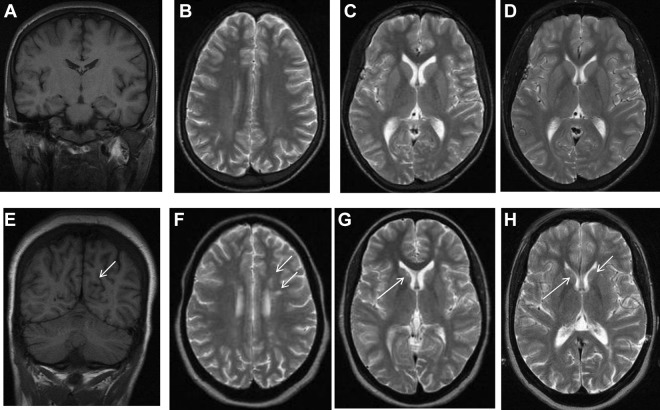
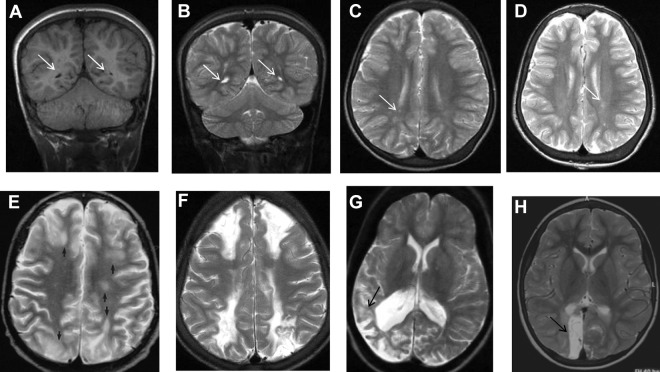
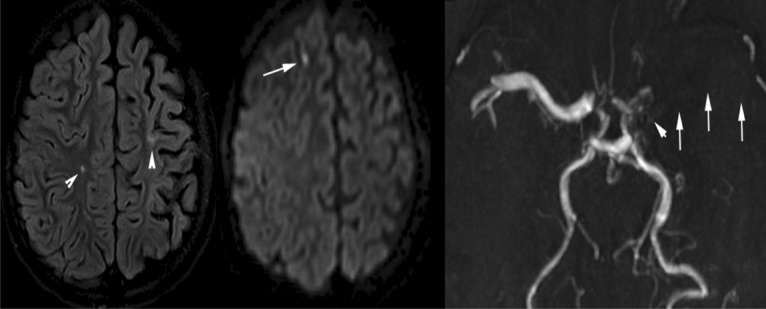
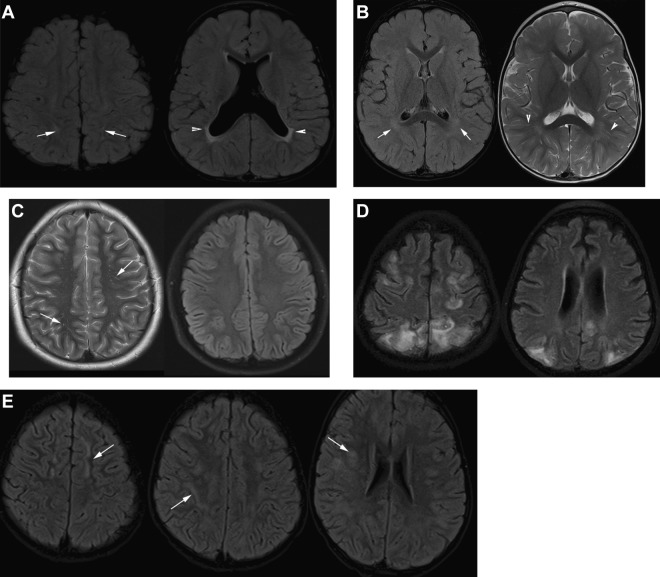
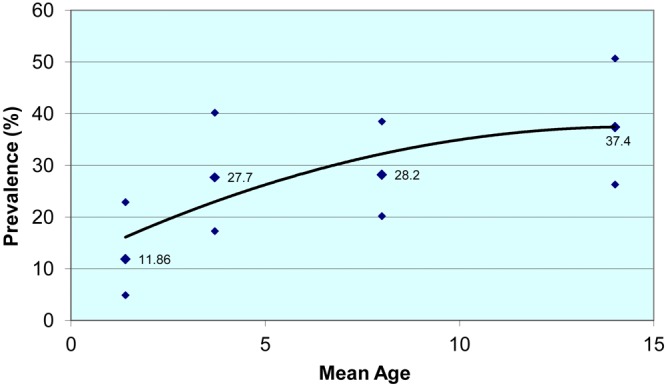
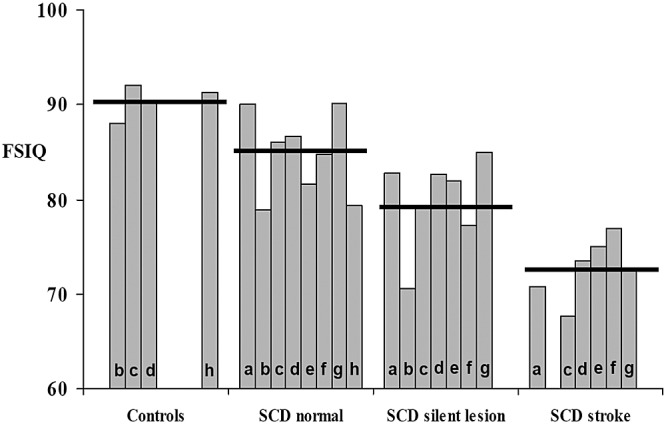
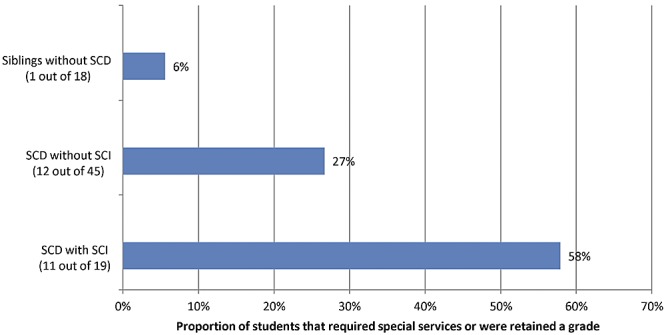
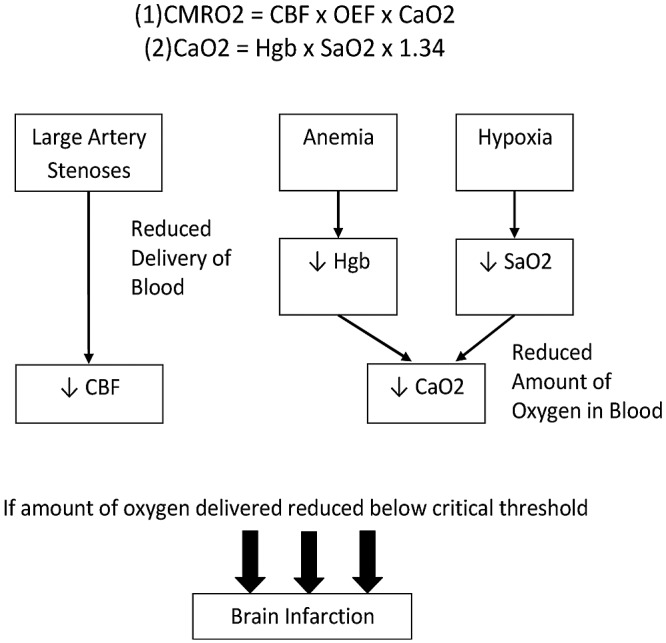
Silent cerebral infarct (SCI) is the most common form of neurologic disease in children with sickle cell anemia (SCA). SCI is defined as abnormal magnetic resonance imaging (MRI) of the brain in the setting of a normal neurologic examination without a history or physical findings associated with an overt stroke. SCI occurs in 27% of this population before their sixth, and 37% by their 14th birthdays. In adults with SCA, the clinical history of SCI is poorly defined, although recent evidence suggests that they too may have ongoing risk of progressive injury. Risk factors for SCI include male sex, lower baseline hemoglobin concentration, higher baseline systolic blood pressure, and previous seizures. Specific morbidity associated with SCI includes a decrement in general intellectual abilities, poor academic achievement, progression to overt stroke, and progressive SCI. In addition, children with previous stroke continue to have both overt strokes and new SCI despite receiving regular blood transfusion therapy for secondary stroke prevention. Studies that only include overt stroke as a measure of CNS injury significantly underestimate the total cerebral injury burden in this population. In this review, we describe the epidemiology, natural history, morbidity, medical management, and potential therapeutic options for SCI in SCA.


Figures

Figure 1
Figure 1
MRI in sickle cell disease. Coronal T1-weighted MRI (A,E) and axial T2-weighted MRI (B-D,F-H) in patients with homozygous SCA. (A-C) Normal MRI in a 19-year-old man with homozygous SCA. (D) Three years later, there is no change. (E-G) Silent infarction (arrows) in the frontal white matter and basal ganglia in a 15-year-old girl with cognitive problems affecting school performance but no acute neurologic presentation. (H) Three years later she has further infarcts with evidence of mild generalized atrophy and had a transient right hemiparesis as well as developing signs of a diplegia.
Figure 2
Figure 2
MRI in sickle cell disease. (A) Coronal T1-weighted MRI, (B) coronal T2-weighted MRI, and (C-H) axial T2-weighted MRI in patients with homozygous SCA. (A-C) Silent cerebral infarction (white arrows) in the parietal white matter in a 10-year-old girl with headache. (D) Three years later, there is progressive atrophy on MRI in the context of intermittent ataxia and squint. (E-H) Four cases associated with acute illness. (E) Silent cerebral infarction (black arrows) in the watershed regions between the anterior, middle, and posterior regions, including the deep white matter, in a patient who had previously had posterior reversible encephalopathy syndrome in the context of cyclosporine treatment for nephrotic syndrome. (F) Bilateral watershed infarction in a child who had seizures in the context of a facial infection. Motor examination was normal but his IQ was reduced by 30 points compared with premorbid testing. (G) Encephalomalacia after sagittal sinus thrombosis secondary to pneumococcal meningitis. (H) Occipital infarction after acute chest crisis. A homonymous visual field defect was detected after the infarct was noted on MRI.
Figure 3
Figure 3
A 10-year-old boy with sickle cell disease and history of acute chest syndrome now presents with pain crisis. MRI of the brain was requested for episodic slurred speech. Axial FLAIR MR image (left) and DWI (middle) illustrate many of the manifestations of SCD in the brain. The arrowheads on the FLAIR image point out areas of old (silent) infarctions in the white matter of the centrum semiovale on the right and at the posterior aspect of the left superior frontal gyrus. The DWI shows an additional area of signal abnormality in the anterior aspect of the right superior frontal gyrus, representing a recent infarction. In addition, there is atrophy of the left cerebral hemisphere, which is seen in the setting of sickle cell–associated vasculopathy manifest by nonvisualization of the left middle cerebral artery by MRA (arrows on the right image). The MRA also shows subtle collaterals (moyamoya vessels) in the lenticulostriate distribution on the left (arrowhead).
Figure 4
Figure 4
Differential diagnosis of silent infarction (images from patients without SCA). (A) Mimics of SCI: periventricular leukomalacia (PVL). A 20-month-old boy with cerebral palsy characterized by spastic diplegia. Axial FLAIR MR images illustrate classic findings of PVL. The image on the left is at the level of the centrum semiovale and demonstrates bilateral hyperintensities in the parietal lobe white matter. This appearance of the white matter overlaps with the presentation of SCI. The image on the right at the level of the basal ganglia illustrates dysmorphic lateral ventricles, thinning of the periventricular white matter and periventricular signal hyperintensity in a predominantly posterior distribution. Taken together, the images are consistent with the diagnosis of PVL in the setting of prematurity and cerebral palsy rather than SCI. (B) Terminal zones of myelination. A 2-year-old boy with a normal MRI of the brain. The Axial FLAIR MR image (left) shows ill-defined hyperintensity bilaterally in the deep white matter adjacent to the atria of the lateral ventricles (arrows). The T2-weighted image on the right illustrates that there are well-defined linear perivascular spaces (arrowheads) traversing the area of vague hyperintensity. This combination of findings is classic for the terminal zones of myelination, the last areas of the deep white matter to myelinate and displace free water. The terminal zones of myelination remain prominent through the second year of life and become progressively less conspicuous over time. They may be visible into the middle of the first decade of life. (C) Virchow-Robin spaces. A 12-year-old boy withT2-weighted (left) and Axial FLAIR (right) MR images with a normal MRI. The T2-weighted images reveal multiple punctuate white matter hyperintensities that suppresses on FLAIR indicating that the hyperintensities are indistinguishable from cerebrospinal fluid. The fluid attenuation feature of the FLAIR image helps to differentiate perivascular (Virchow-Robin) spaces from SCI. The arrows illustrate another feature of perivascular spaces which is that they appear linear when running within the slice. (D) Posterior reversible encephalopathy syndrome (PRES). A 14-year-old girl with altered mental status and seizures. Axial FLAIR MR images demonstrate hyperintensities bilaterally in the subcortical white matter and overlying cortex with predominant subcortical involvement. The distribution of the signal abnormalities is predominantly posterior and peripheral, a typical distribution for PRES. In contradistinction, SCIs favor the deep white matter of the frontal lobes. Nevertheless, clinical context is the key to differentiating PRES from SCIs. This is especially challenging in patients with SCD because they are prone to development of PRES and SCI. (E) Acute disseminated encephalomyelitis (ADEM). A 5-year-old boy with fever and headache. Axial FLAIR MR images demonstrate patchy, bilateral hyperintensities in the white matter of the centrum semiovale and corona radiata (arrows). Although the image on the left could be confused for SCI in the frontal border zone distribution, the middle and right image show subcortical and patchy hyperintensities that would be atypical in location, size, and lesion definition for SCI. The clinical information is the key to distinguishing lesions of ADEM from SCI.
Figure 5
Figure 5
Prevalence of SCI with 95% CIs plotted against age from 4 studies.,,,
Figure 6
Figure 6
Mean Wechsler FSIQ scores obtained from children with SCD and sibling controls as reported in 8 studies. The horizontal black line represents the mean value for each category of children. FSIQ scores have a mean of 100 (SD 15). Scores above 80 are within the average range according to Wechsler classification. (A) Armstrong et al (Normal MRI, n = 105; Silent Infarct, n = 21; Clinical History of Stroke, n = 9; age range, 6-12 years). (B) Steen et al (Historical Control Data, n = 30; Normal cMRI, n = 12; Abnormal cMRI, n = 10; mean age, 10 years; SD, 3 years). (C) Watkins et al (Control, n = 15; SCD/nm, n = 15; Asymptomatic, n = 4; Symptomatic, n = 5; age range, 5-16 years). (D) Bernaudin et al (Siblings, n = 76; Normal MRI, n = 104; Silent Stroke, n = 17; With (Overt) Stroke, n = 11; age range, 5-15 years). (E) Brown et al (no cerebrovascular accident [CVA], n = 30; Silent, n = 11; CVA, n = 22; age range, 6-17 years). (F) Wang et al (Normal MRI, n = 122; Silent Infarct, n = 43; Stroke, n = 20; age range, 6-18 years). (G) Thompson et al (First Visit: Normal, n = 93; Silent Infarct, n = 29; Stroke, n = 6; age range, 5-15 years). (H) Steen et al (African-American Controls, n = 30; Patients, n = 30; mean age, 10 years; SD, 2.9 years).
Figure 7
Figure 7
The proportion of students with SCA with and without SCIs and sibling controls that have either failed a grade or received special services.
Figure 8
Figure 8
Potentially synergistic factors leading to SCI in SCA. Modified from DeBaun et al with permission. Equation 1: The CMRO2 is the cerebral metabolic rate for oxygen. The brain relies on a constant delivery of oxygen to maintain CMRO2. If the delivery is inadequate, permanent tissue injury can occur, depending on the depth and duration of the ischemia. The equation above relates cerebral blood flow (CBF; the bulk delivery of blood to the brain), oxygen extraction fraction (OEF; the fraction of available oxygen blood that leaves the blood by passive diffusion as it passes through the circulation), and the arterial oxygen content (CaO2). Equation 2: CaO2, in turn, is a product of the hemoglobin content of blood and the arterial oxygen saturation. Reduced hemoglobin (Hgb; or oxygen carrying capacity of the existing Hgb) or hypoxia may reduce the arterial oxygen content. One can see the potentially synergystic effects of these relationships in reducing the oxygen delivery to the brain below critical thresholds. CaO2 can fall because of anemia and hypoxia and CBF can fall because of the large artery vasculopathy. Patients with preexisting arteriopathy may be more likely to suffer an ischemic stroke than other patients with the same degree of anemia or hypoxia.

References

    1. Kwiatkowski JL, Zimmerman RA, Pollock AN, et al. Silent infarcts in young children with sickle cell disease. Br J Haematol. 2009;146(3):300–305. - PMC - PubMed
    1. Bernaudin F, Verlhac S, Arnaud C, et al. Impact of early transcranial Doppler screening and intensive therapy on cerebral vasculopathy outcome in a newborn sickle cell anemia cohort. Blood. 2011;117(4):1130–1140. quiz 1436. - PubMed
    1. Hindmarsh PC, Brozovic M, Brook CG, Davies SC. Incidence of overt and covert neurological damage in children with sickle cell disease. Postgrad Med J. 1987;63(743):751–753. - PMC - PubMed
    1. Watkins KE, Hewes SKM, Connelly A, et al. Cognitive deficits associated with frontal-lobe infarction in children with sickle cell disease. Dev Med Child Neurol. 1998;40(8):536–543. - PubMed
    1. Moser FG, Miller ST, Bello JA, et al. The spectrum of brain MR abnormalities in sickle-cell disease: a report from the Cooperative Study of Sickle Cell Disease. Am J Neuroradiol. 1996;17(5):965–972. - PMC - PubMed

Publication types

MeSH terms