. 2012 May;80(5):1858-67.
doi: 10.1128/IAI.06075-11. Epub 2012 Feb 21.

Escherichia coli uropathogenesis in vitro: invasion, cellular escape, and secondary infection analyzed in a human bladder cell infection model

Affiliations

Escherichia coli uropathogenesis in vitro: invasion, cellular escape, and secondary infection analyzed in a human bladder cell infection model

Thomas E Andersen et al. Infect Immun. 2012 May.

Abstract

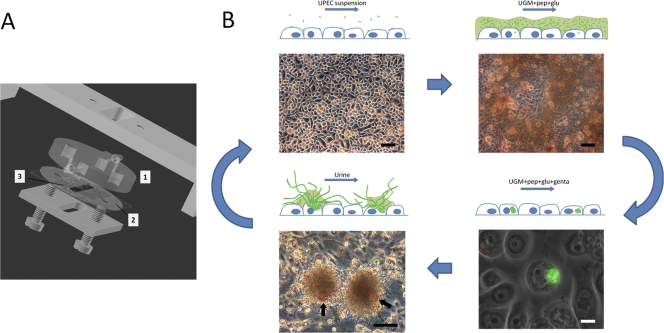
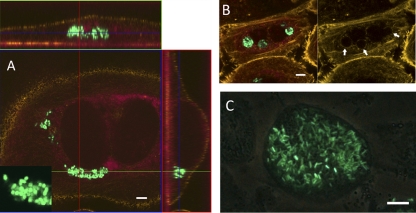
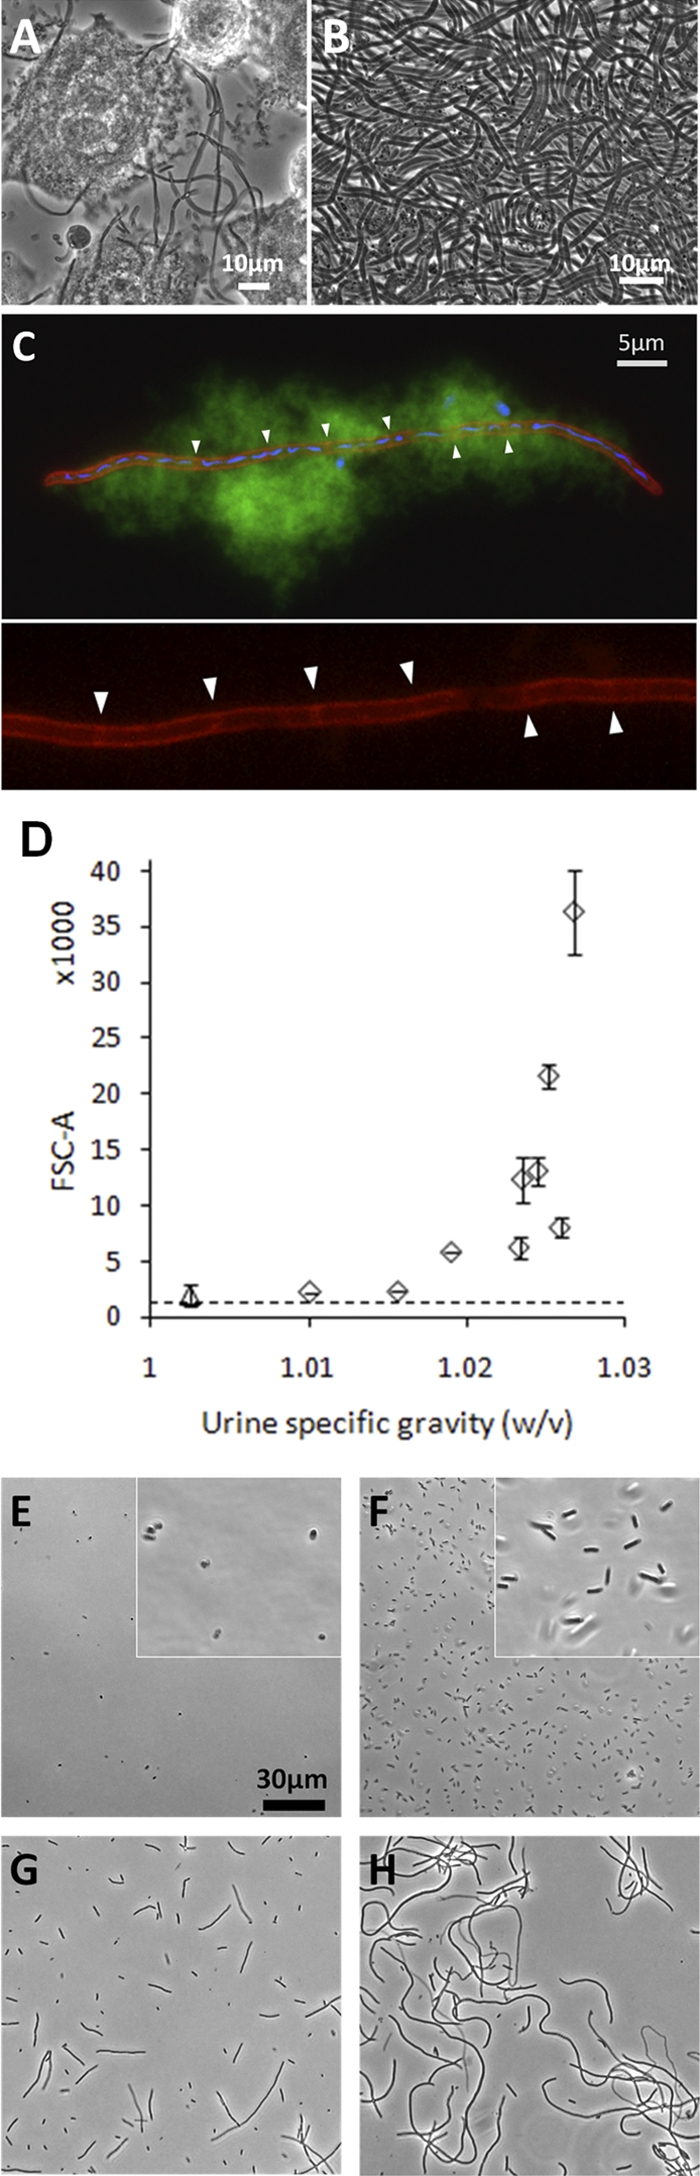
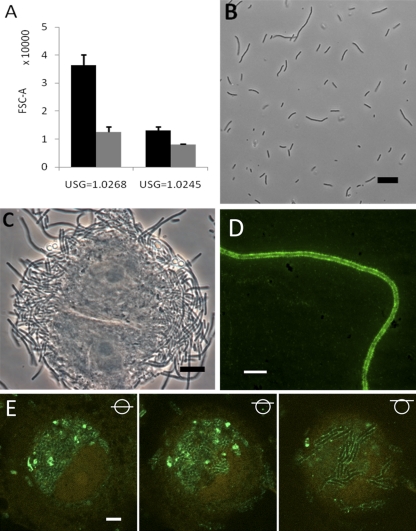
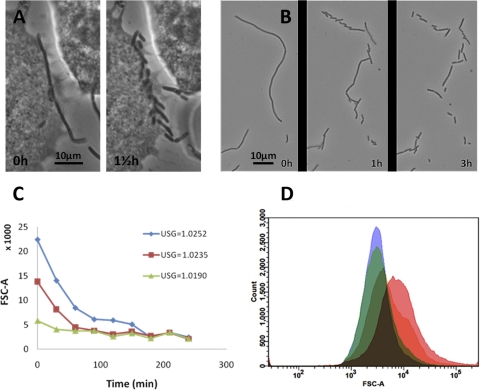
Uropathogenic Escherichia coli (UPEC) strains are capable of invading bladder epithelial cells (BECs) on the bladder luminal surface. Based primarily on studies in mouse models, invasion is proposed to trigger an intracellular uropathogenic cascade involving intracellular bacterial proliferation followed by escape of elongated, filamentous bacteria from colonized BECs. UPEC filaments on the mouse bladder epithelium are able to revert to rod-shaped bacteria, which are believed to invade neighboring cells to initiate new rounds of intracellular colonization. So far, however, these late-stage infection events have not been replicated in vitro. We have established an in vitro model of human bladder cell infection by the use of a flow chamber (FC)-based culture system, which allows investigation of steps subsequent to initial invasion. Short-term bacterial colonization on the FC-BEC layer led to intracellular colonization. Exposing invaded BECs to a flow of urine, i.e., establishing conditions similar to those faced by UPEC reemerging on the bladder luminal surface, led to outgrowth of filamentous bacteria similar to what has been reported to occur in mice. These filaments were capable of reverting to rods that could invade other BECs. Hence, under growth conditions established to resemble those present in vivo, the elements of the proposed uropathogenic cascade were inducible in a human BEC model system. Here, we describe the model and show how these characteristics are reproduced in vitro.


Figures

Fig 1
Fig 1
(A) Diagram of flow chamber with uroepithelium cell culture. Flow to and from the substratum surface is maintained through the upper polycarbonate disc (mark 1) machined with connecting pipes and inner channels. Ongoing infection is observed in situ through the polycarbonate disc. A silicone gasket (mark 2) with central slit (mark 3) defines the flow channel dimensions on a cell cultured glass slide. (B) Uropathogenic cascade in vitro. The scheme outlines the complete cycle of UPEC intracellular infection induced in vitro. UPEC bacteria are seeded onto an FC-BEC culture (upper left) and subsequently induced to colonize the surface (upper right). During coculturing of bacteria and BEC, single bacteria invade BECs and initiate intracellular colonization (lower right). After elimination of extracellular bacteria and during continuing coculture of the BEC layer with intracellular bacteria, some cells become extensively colonized, leading to their eruption (lower left). During escape from colonized, loosely attached BECs (indicated with arrows in the lower left panel), a secondary colonization initiates in the form of distinct aggregates of filamentous bacteria associated with the BEC (lower left) or of loosely dispersed bacteria, depending on the urine concentration. The filamentous UPEC bacteria can revert to single cells capable of reinvasion, which may lead to subsequent rounds of the uropathogenic cascade. Upper images and lower left image are from in situ FC microscopy, showing the undisturbed bacterial colonization. UGM, uroepithelium growth medium; pep, peptone; glu, glucose; genta, gentamicin. Bars, 100 μm (black) and 10 μm (white).
Fig 2
Fig 2
Intracellular colonization of FC-PD07i cell layers. PD07i cell layers were infected with UTI89-pEGFP in FCs as described in the text, with subsequent gentamicin treatment followed by inspection with CLSM (A and B) or fluorescence phase-contrast microscopy (C). For the CLSM images, cytoskeleton and membrane boundaries were visualized by Acti-stain 555 and cell nuclei were visualized using the background laser signal (red). (A) Invaded binuclear PD07i cell with cytosolic UTI89-pEGFP. Bacteria were coccoid in shape, as shown in the inset. Vertical and horizontal cross-sections of the Z-stack are shown. (B) Invading UTI89-pEGFP appears to be localized to vesicle compartments. The image at the right shows the actin stain alone, indicating vesicle boundaries (arrows). (C) late-stage intracellularly colonized PD07i cell. Bars, 10 μm.
Fig 3
Fig 3
UPEC filamentation during secondary infection in vitro. (A) Phase-contrast microscopy of a PD07i cell layer after FC infection with UTI89 and secondary surface colonization in moderately concentrated urine. (B) Bacterial harvest after secondary surface colonization in highly concentrated urine showed an essentially 100% filamentous population. (C) Membrane and DNA visualized in harvested filament by the use of FM4-64 and DAPI dyes, respectively. As is characteristic for sessile growth, the filament is embedded in biofilm slime, as visualized by its autofluorescence in the green channel. Partial septa are indicated with arrowheads in the magnified inset in the lower panel, showing the red channel only. (D) FSC-A values measured for bacteria harvested after secondary surface colonization in urine specimens at 10 different concentrations. Counts (105) were collected for each sample, and each point in the graph indicates the mean value of the results of two independent experiments with ±1 SD. The dotted line indicates the mean FSC-A value for agar-plated UTI89. Data from samples obtained using the most dilute urine differentiated from the other points in that those samples did not originate from visible surface colonization (see text) and hence are marked with a triangle. (E to H) Phase-contrast images of UTI89 harvested after secondary surface colonization in urine specimens with USG values of 1.0025 (E), 1.0156 (F), 1.0235 (G), and 1.0268 (H).
Fig 4
Fig 4
Filament enrichment on FC-BEC layers correlates with observed increased filament adhesion. (A) Examples showing the difference in filamentation after 24 h of FC secondary surface colonization (black columns) compared to that seen after 24 h of UTI89 static suspension growth (gray columns) in highly and moderately concentrated urine. Mean values representing the results of two independent FC experiments and three static experiments are shown; P = 0.0023 and 0.0051, respectively (two-sample t test). (B) Microscopy of UTI89 statically grown for 24 h in the most concentrated urine tested in FCs (compare with Fig. 3H). (C) PD07i cell obtained during filament harvest, showing tight association with filaments. (D) Fluorescence micrograph showing type 1 pili on a harvested filament. (E) CLSM analysis of UPEC type 1 pilus expression in an extensively colonized, partly degraded cell in the FC-BEC layer. The left image shows type 1 pilus-expressing UTI89 in the BEC cytoplasm next to a distorted cell nucleus. The middle and right images are scans made at positions of successively increasing heights (indicated with symbols), showing type 1 pilus-expressing UTI89 in the upper part of the cell (middle image) and filamentous UTI89 bacteria at the cell membrane that express type 1 pili along their lengths (right image). Bars, 10 μm (C, D, and E) and 20 μm (B).
Fig 5
Fig 5
UTI89 filament reversal to rod-shaped bacteria. (A) A filament adhering to a PD07i cell undergoes reversal. (B) Reversal of a harvested filament. (C) Time course measurements of FSC-A values of three samples exhibiting different initial degrees of filamentation. The samples were harvested after secondary surface colonization in urine specimens with the USG values indicated in the graph. (D) Histogram overlay showing the time-dependent shift in FSC-A of the sample with highest initial FSC-A value from the experiment in which the urine with USG = 1.0252 was used. Pink, red, green, and blue histograms in the overlay refer to time points 0, 30, 60, and 90 min after harvest.

References

    1. Andersen TE, et al. 2010. A flow chamber assay for quantitative evaluation of bacterial surface colonization used to investigate the influence of temperature and surface hydrophilicity on the biofilm forming capacity of uropathogenic Escherichia coli. J. Microbiol. Methods 81:135–140 - PubMed
    1. Anderson GG, Moreau-Marquis S, Stanton BA, O'Toole GA. 2008. In vitro analysis of tobramycin-treated Pseudomonas aeruginosa biofilms on cystic fibrosis-derived airway epithelial cells. Infect. Immun. 76:1423–1433 - PMC - PubMed
    1. Anderson GG, et al. 2003. Intracellular bacterial biofilm-like pods in urinary tract infections. Science 301:105–107 - PubMed
    1. Bakker DP, van der Plaats A, Verkerke GJ, Busscher HJ, van der Mei HC. 2003. Comparison of velocity profiles for different flow chamber designs used in studies of microbial adhesion to surfaces. Appl. Environ. Microbiol. 69:6280–6287 - PMC - PubMed
    1. Beloin C, et al. 2004. Global impact of mature biofilm lifestyle on Escherichia coli K-12 gene expression. Mol. Microbiol. 51:659–674 - PubMed

Publication types