. 2012 May;80(5):1923-33.
doi: 10.1128/IAI.06120-11. Epub 2012 Feb 21.

Mannheimia haemolytica and its leukotoxin cause macrophage extracellular trap formation by bovine macrophages

Affiliations

Mannheimia haemolytica and its leukotoxin cause macrophage extracellular trap formation by bovine macrophages

Nicole A Aulik et al. Infect Immun. 2012 May.

Abstract

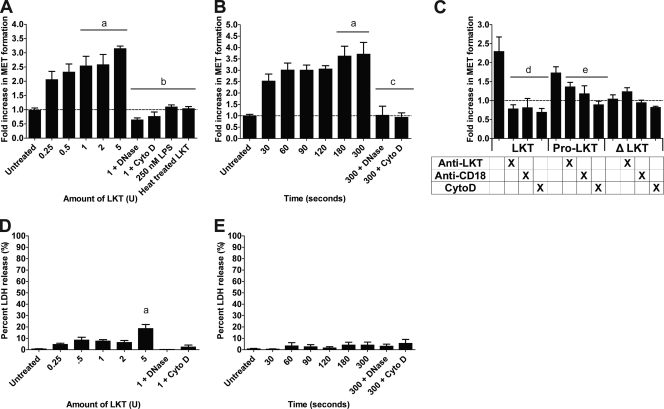
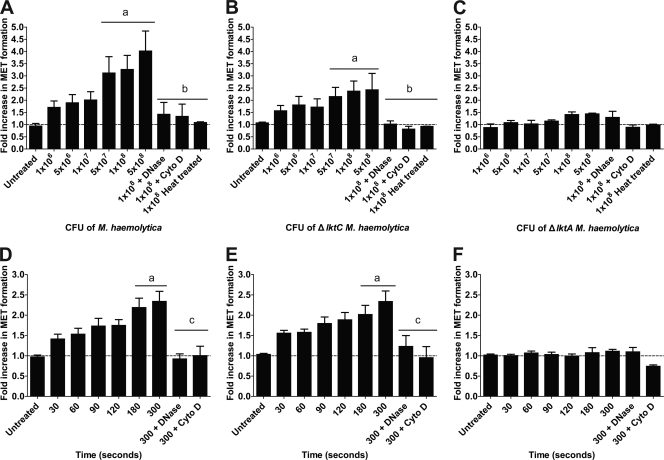
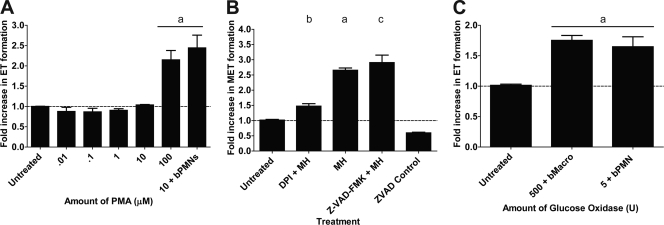
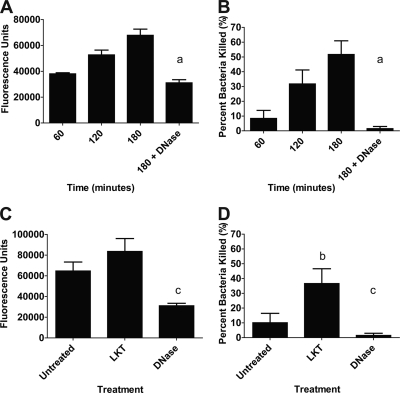
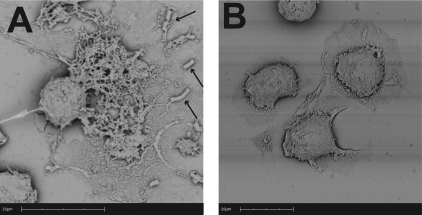
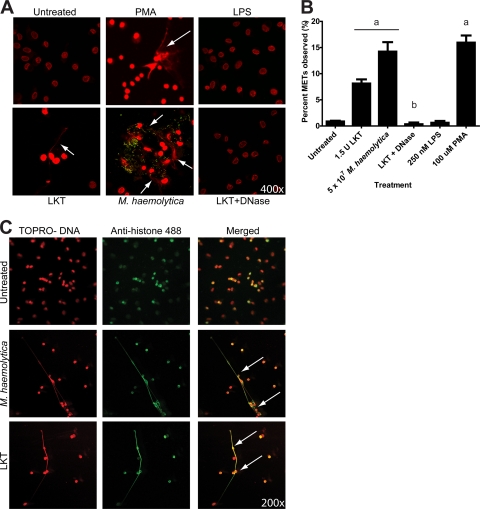
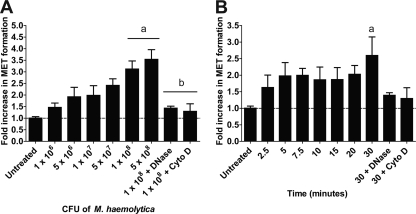
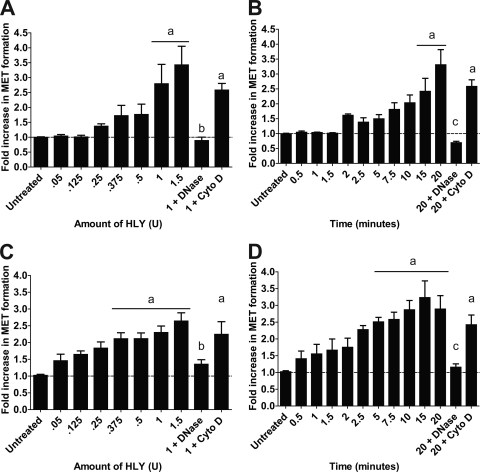
Human and bovine neutrophils release neutrophil extracellular traps (NETs), which are protein-studded DNA matrices capable of extracellular trapping and killing of pathogens. Recently, we reported that bovine neutrophils release NETs in response to the important respiratory pathogen Mannheimia haemolytica and its leukotoxin (LKT). Here, we demonstrate macrophage extracellular trap (MET) formation by bovine monocyte-derived macrophages exposed to M. haemolytica or its LKT. Both native fully active LKT and noncytolytic pro-LKT (produced by an lktC mutant of M. haemolytica) stimulated MET formation. Confocal and scanning electron microscopy revealed a network of DNA fibrils with colocalized histones in extracellular traps released from bovine macrophages. Formation of METs required NADPH oxidase activity, as previously demonstrated for NET formation. METs formed in response to LKT trapped and killed a portion of the M. haemolytica cells. Bovine alveolar macrophages, but not peripheral blood monocytes, also formed METs in response to M. haemolytica cells. MET formation was not restricted to bovine macrophages. We also observed MET formation by the mouse macrophage cell line RAW 264.7 and by human THP-1 cell-derived macrophages, in response to Escherichia coli hemolysin. The latter is a member of the repeats-in-toxin (RTX) toxin family related to the M. haemolytica leukotoxin. This study demonstrates that macrophages, like neutrophils, can form extracellular traps in response to bacterial pathogens and their exotoxins.


Figures

Fig 1
Fig 1
LKT and pro-LKT cause MET formation by bovine macrophages. (A and B) Bovine macrophages (105) were incubated with various amounts of LKT for 20 min (A) or were incubated with 0.5 U of LKT for various times (B). As a control, 105 bovine macrophages were preincubated with 180 U of DNase I or 10 μg/ml Cyto D, to degrade extracellular DNA or inhibit LKT internalization, respectively. In some experiments, 105 bovine macrophages were incubated with 250 nM M. haemolytica LPS and 1 U heat-inactivated LKT (100°C for 30 min). Untreated cells were incubated with RPMI 1640 as a negative control. (C) Bovine macrophages (105) were incubated with 1 U LKT, pro-LKT, or ΔLKT for 20 min. Some bovine macrophages were incubated with an anti-CD18 antibody or 10 μg/ml cytochalasin D, or the toxins were incubated with an anti-LKT antibody for 30 min prior to addition to macrophages. For panels A to C, extracellular DNA was quantified by the addition of a 1:200 dilution of PicoGreen and fluorescence was quantified using an automated plate reader. Results are expressed as the fold increase compared to untreated cells. (D and E) Bovine macrophages (105) were incubated with various amounts of LKT for 20 min (D) or were incubated with 0.5 U of LKT for various times (E). LDH was quantified using the CytoTox 96 nonradioactive cytotoxicity assay as described by the manufacturer. Data represent the mean ± SEM of 5 independent experiments. a, P < 0.05 compared to untreated macrophages; b, P < 0.05 compared to macrophages treated with 1 U LKT; c, P < 0.05 compared to macrophages treated with LKT for 5 min; d, P < 0.05 compared to macrophages incubated with LKT alone; e, P < 0.05 compared to macrophages incubated with pro-LKT alone.
Fig 2
Fig 2
Wild-type M. haemolytica and ΔlktC M. haemolytica cells cause MET formation by bovine macrophages. Monocyte-derived macrophages (105) were incubated for 20 min with various cell numbers of M. haemolytica (A), ΔlktC M. haemolytica (B), or ΔlktA M. haemolytica (C). In some experiments, bacteria were inactivated at 100°C for 30 min prior to addition to macrophages. (D to F) Macrophages (105) were incubated for various times with 1 × 10⁷ cells of wild-type M. haemolytica (D), ΔlktC M. haemolytica (E), or ΔlktA M. haemolytica (F). In some experiments, 180 U of DNase I or 10 μg/ml cytochalasin D was incubated with the macrophages for 30 min at 37°C prior to addition of the bacterial cells. Extracellular DNA was quantified using PicoGreen as described in Materials and Methods. Data represent the mean ± SEM of 5 independent experiments. a, P < 0.05 compared to untreated macrophages; b, P < 0.05 compared to macrophages incubated with 1 × 10⁸ bacteria; c, P < 0.05 compared to macrophages incubated for 300 s with bacterial cells alone.
Fig 3
Fig 3
MET formation requires NADPH oxidase activity. (A) Bovine macrophages (105) were incubated with various concentrations of PMA. As a positive control, 105 bovine neutrophils were incubated with 10 μM PMA. (B) Bovine macrophages (105) were preincubated with 50 μM DPI for 30 min at 37°C. DPI-treated and untreated macrophages (105) were then incubated with 5 × 10⁷ M. haemolytica cells (MH). As a control, some macrophages were incubated with 200 μM the pancaspase inhibitor Z-VAD-FMK prior to addition of 5 × 10⁷ M. haemolytica cells. (C) Bovine macrophages or neutrophils (105) were incubated with 500 U or 5 U glucose oxidase, respectively. Extracellular DNA was quantified using PicoGreen as described in Materials and Methods. Data represent the mean ± SEM of 5 independent experiments. a, P < 0.05 compared to untreated macrophages; b, P < 0.05 compared to macrophages incubated with 5 × 10⁷ M. haemolytica; c, P < 0.05 compared to Z-VAD-FMK control macrophages.
Fig 4
Fig 4
Preincubating bovine macrophages with LKT increases the trapping and killing of M. haemolytica by METs. Bovine macrophages (105) were incubated with 107 fluorescein-labeled M. haemolytica cells (A) or unlabeled M. haemolytica cells (B) for 60, 120, or 180 min. Similarly, LKT-treated (0.5 U LKT for 30 min) or untreated macrophages were incubated for 60 min with 107 fluorescein-labeled M. haemolytica cells (C) or 107 unlabeled M. haemolytica cells (D). Untreated macrophages were used as controls. Additional controls included macrophages incubated with M. haemolytica and 180 U DNase I. Bacterial trapping was estimated by fluorescence using an automated plate reader. Bacterial survival was estimated by plating serial dilutions of lysates on TSA–5% sheep RBC plates. Data represent the mean ± SEM of 5 independent experiments. a, P < 0.05 compared to macrophages incubated with M. haemolytica for 180 min; b, P < 0.05 compared to untreated macrophages; c, P < 0.05 compared to macrophages treated with LKT alone.
Fig 5
Fig 5
Scanning electron photomicrographs of METs formed by bovine macrophages in response to M. haemolytica cells. Bovine macrophages (2.5 × 10⁵) were incubated with 5 × 10⁷ M. haemolytica cells or RPMI 1640 (negative control) for 5 min at 37°C. Cells were washed, fixed, and processed for SEM as described in Materials and Methods. (A) A matrix of extracellular DNA strands released in response to M. haemolytica cells (arrows indicate trapped bacterial cells); (B) control bovine macrophages incubated with RPMI that do not exhibit extracellular DNA fibrils. Photomicrographs are of representative cells from 3 independent experiments.
Fig 6
Fig 6
Confocal microscopy of METs formed by bovine macrophages in response to LKT and M. haemolytica. (A) Macrophages (2.5 × 10⁵) were incubated for 30 min at 37°C with 1 U LKT, 1 U LKT with 180 U DNase I, 107 fluorescein-labeled M. haemolytica cells, 100 mM PMA, 250 nM M. haemolytica LPS, or RPMI 1640 (negative control). Cells were fixed, permeabilized, stained for DNA using TOPRO, and examined by confocal microscopy. Arrows indicate representative METs emanating from macrophages. (B) Percentage of macrophages that formed METs, based on scoring of 500 macrophages in multiple micrographs. a, P < 0.05 compared to untreated macrophages; b, P < 0.05 compared to macrophages incubated with 1.5 U LKT. Photomicrographs are of representative cells from 3 independent experiments. (C) To assess colocalization of DNA and histones in METs, 2.5 × 10⁵ macrophages were incubated with 1 U LKT or 107 M. haemolytica cells for 30 min. Cells were fixed, permeabilized, stained for DNA using TOPRO (red), and probed for histones using an antihistone antibody followed by an antimouse antibody labeled with Alexa Fluor 488 (green). Cells were examined by confocal microscopy. Arrows indicate areas of colocalization of signals for extracellular DNA and histones. Photomicrographs are of representative cells from 3 independent experiments.
Fig 7
Fig 7
Bovine alveolar macrophages produce METs in response to M. haemolytica. Bovine alveolar macrophages (105) were incubated with various numbers of M. haemolytica cells for 30 min (A) or were incubated with 107 M. haemolytica cells for various times (B). As a control, 105 bovine alveolar macrophages were preincubated with 180 U of DNase I or 10 μg/ml Cyto D. Extracellular DNA was quantified using PicoGreen as described in Materials and Methods. Data represent the mean ± SEM of 5 independent experiments. a, P < 0.05 compared to untreated macrophages; b, P < 0.05 compared to macrophages incubated with 1 × 10⁸ M. haemolytica cells.
Fig 8
Fig 8
RAW 264.7 murine and THP-1-derived human macrophages produce METs in response to E. coli HLY. (A and B) RAW 264.7 macrophages (105) were incubated with various amounts of E. coli HLY for 20 min (A) or were incubated with 0.5 U HLY for various times (B). (C and D) THP-1-derived macrophages (105) were incubated with various amounts of HLY for 20 min (C) or were incubated with 0.5 U HLY for various times (D). As additional controls, 105 macrophages were preincubated with 180 U of DNase I or 10 μg/ml Cyto D. Extracellular DNA was quantified using PicoGreen as described in Materials and Methods. Data represent the mean ± SEM of 5 independent experiments. a, P < 0.05 compared to untreated macrophages; b, P < 0.05 compared to macrophages incubated with 1 U of HLY; c, P < 0.05 compared to macrophages treated for 20 min with HLY.

References

    1. Ackermann MR, et al. 1994. Distribution of anti-CD68 (EBM11) immunoreactivity in formalin-fixed, paraffin-embedded bovine tissues. Vet. Pathol. 31:340–348 - PubMed
    1. Atapattu DN, Albrecht RM, McClenahan DJ, Czuprynski CJ. 2008. Dynamin-2-dependent targeting of Mannheimia haemolytica leukotoxin to mitochondrial cyclophilin D in bovine lymphoblastoid cells. Infect. Immun. 76:5357–5365 - PMC - PubMed
    1. Aulik N, Hellenbrand K, Kisiela D, Czuprynski C. 2011. Mannheimia haemolytica leukotoxin binds cyclophilin D on bovine neutrophil mitochondria. Microb. Pathog. 50:168–178 - PubMed
    1. Aulik N, Hellenbrand K, Klos H, Czuprynski C. 2010. Mannheimia haemolytica and its leukotoxin causes neutrophil extracellular trap (NET) formation by bovine neutrophils. Infect. Immun. 78:4454–4466 - PMC - PubMed
    1. Bartneck M, Keul H, Zwadlo-Klarwasser G, Groll J. 2010. Phagocytosis independent extracellular nanoparticle clearance by human immune cells. Nano Lett. 10:59–63 - PubMed

Publication types

LinkOut - more resources