. 2012 Apr 18;31(8):1893-903.
doi: 10.1038/emboj.2012.41. Epub 2012 Feb 21.

N-cadherin specifies first asymmetry in developing neurons

Affiliations

N-cadherin specifies first asymmetry in developing neurons

Annette Gärtner et al. EMBO J. .

Abstract

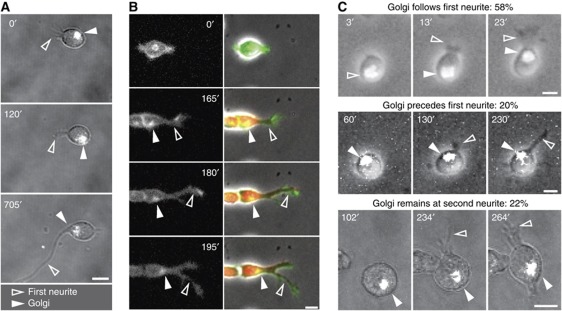
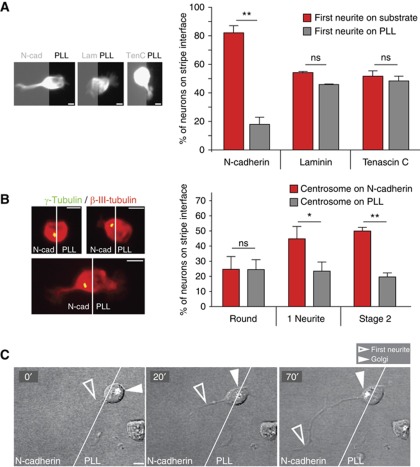
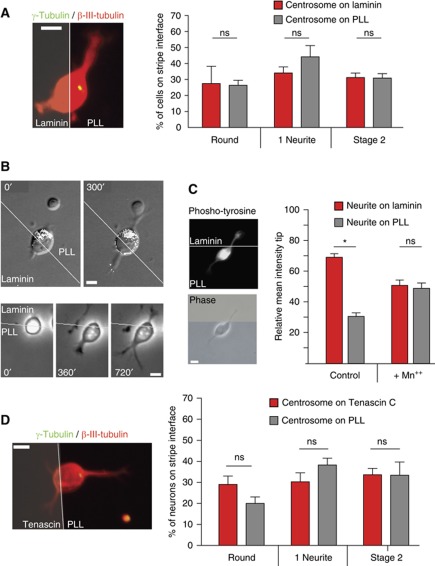
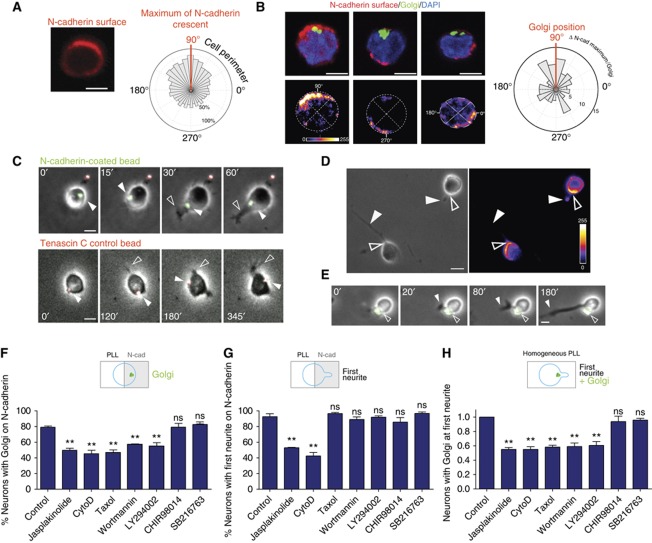
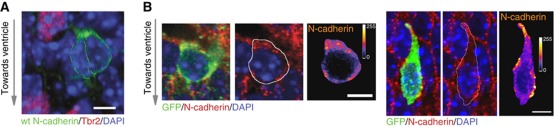
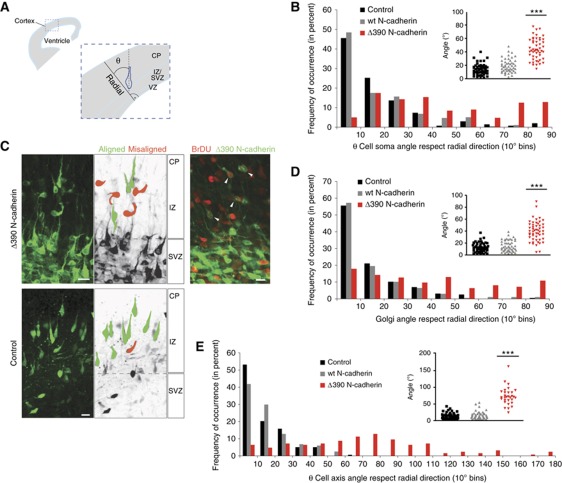
The precise polarization and orientation of developing neurons is essential for the correct wiring of the brain. In pyramidal excitatory neurons, polarization begins with the sprouting of opposite neurites, which later define directed migration and axo-dendritic domains. We here show that endogenous N-cadherin concentrates at one pole of the newborn neuron, from where the first neurite subsequently emerges. Ectopic N-cadherin is sufficient to favour the place of appearance of the first neurite. The Golgi and centrosome move towards this newly formed morphological pole in a second step, which is regulated by PI3K and the actin/microtubule cytoskeleton. Moreover, loss of function experiments in vivo showed that developing neurons with a non-functional N-cadherin misorient their cell axis. These results show that polarization of N-cadherin in the immediate post-mitotic stage is an early and crucial mechanism in neuronal polarity.


Conflict of interest statement

The authors declare that they have no conflict of interest.

Figures

Figure 1
Figure 1
First neurite formation precedes Golgi and centrosome translocation. (AC) Time-lapse analysis of Golgi movements in polarizing neurons. (A) Hippocampal neurons transfected with the N-terminus of galactosyltransferase tagged with GFP (GT–GFP) to visualize the Golgi (white in grey image). (B) Mouse embryonic 12.5 cortical neurons transfected with a palmitoylated version of EGFP to visualize cell membrane morphology and Golgi positioning (see Supplementary Figure S1A). Cherry fluorescent protein expressed by the neuron-specific α-tubulin promoter (red in merged images) is used to identify terminally differentiated neurons. (C) Examples of neurons expressing GT–GFP with a de novo assembled Golgi after BFA treatment and washout. Golgi: filled arrowheads. First neurite: open arrowheads. All scale bars=5 μm.
Figure 2
Figure 2
N-cadherin determines the site of first neurite growth and subsequently recruits Golgi and centrosome. (A) Examples of neurons immunolabelled with anti-βIII-tubulin developing on coverslips coated with alternating stripes of the indicated substrate and PLL. Quantification of neurons with the soma on the interface of the two substrates shows that neurons grow the first neurite preferentially at the N-cadherin facing pole (experimental n=4). Asymmetric contact with either laminin (n=4) or Tenascin C (n=3) does not trigger outgrowth of the first neurite (⩾9 neurons/experiment). (B) Examples of centrosome position in hippocampal neurons immunolabelled with a neuron-specific antibody (anti-βIII-tubulin) and with an antibody recognizing the centrosome (anti-γ-tubulin) with their soma on the PLL/N-cadherin interface. The centrosome position of neurons was quantified at different developmental stages (round neurons n=5, one neurite n=7, stage 2 neurons n=9, ⩾8 cells/experiment). The centrosome is recruited towards the N-cadherin substrate. (A, B) t-Test, *P<0.05, **P<0.001. (C) Time-lapse sequence of a neuron developing on the interface of N-cadherin and PLL transfected with GT–EGFP: after the outgrowth of the first neurite (open arrowhead) on the N-cadherin stripe, the Golgi (filled arrowhead) is recruited to this site. All scale bars=5 μm.
Figure 3
Figure 3
Golgi and centrosome recruitment is substrate specific. (A) Hippocampal neurons growing on coverslips coated with alternating stripes of laminin and PLL were immunolabelled with a neuron-specific antibody (anti-βIII-tubulin) and with an antibody recognizing the centrosome (anti-γ-tubulin). The centrosome position was quantified at different developmental stages (experimental n=5 in round neurons, n=7 in one neurite neurons, n=9 in stage 2 neurons; ⩾8 cells/experiment). (B) Time-lapse sequence of a hippocampal neuron developing on the interface of Laminin and PLL transfected with GT–EGFP: neither the outgrowth of the first neurite (lower panel) nor the position of the Golgi (upper panel, Golgi is shown in white in the grey image) is influenced by laminin. (C) Laminin induces local integrin signalling at early time points evident by a spatially restricted increase in phospho-tyrosine signal. Manganese treatment inhibits integrin signalling and as a consequence local tyrosine-phosphorylation, demonstrating that this is a specific effect. (D) Hippocampal neurons were plated on coverslips coated with alternating stripes of Tenascin C and PLL, fixed after different times and immunolabelled with a neuron-specific antibody (βIII-tubulin) and antibodies recognizing the centrosome (anti-γ-tubulin, filled arrowheads). The position of the centrosome in neurons being in contact with both substrates with respect to Tenascin C at different developmental stages was monitored (experimental n=3 in round neurons, n=4 one neurite, n=5 stage 2 neurons, ⩾8 cells/experiment, two-tailed paired t-test).
Figure 4
Figure 4
N-cadherin accumulates in one pole and mediates centrosome repositioning via PI3K and actin. (A) Labelling of surface N-cadherin and alignment of maxima of N-cadherin surface fluorescence in round neurons shows the presence of an N-cadherin accumulation (circular graph represents the mean fluorescence at the cell surface respect the maximum: experimental n=3, 15 cells/experiment). (B) This N-cadherin accumulation is not always correlated with the Golgi pole as shown by a frequency distribution of the angles between the Golgi and N-cadherin maxima in individual neurons in the circular frequency plot. (C) Beads (1 μm diameter) coated with N-cadherin (green) are recruited to the site from which the first neurite is growing (upper panel), while Tenascin C coated control beads (red) are not recruited to any specific site of the cell surface (lower panel). (D) N-cadherin is still concentrated at the site from which the first neurite grows, here demonstrated by the polarized surface distribution of N-cadherin and (E): the stable attachment of N-cadherin-coated beads. All scale bars=5 μm. (F, G) Hippocampal neurons grown in the presence of specific inhibitors on coverslips coated with alternating stripes of N-cadherin and PLL were fixed after different times and immunolabelled with an antibody recognizing the centrosome or the Golgi and the neuron-specific antibody anti-βIII-tubulin. (F) Fraction of neurons recruiting the Golgi/centrosome towards N-cadherin. (G) Fraction of neurons orienting the first neurite towards N-cadherin. (H) Hippocampal neurons were grown on homogeneous PLL in the presence of toxins, fixed and immunolabelled as in (F, G). Fraction of neurons grown only on PLL in which the first bud is located at the Golgi/centrosome pole. (FH) ⩾10 neurons/experiment. Experimental n=3. ANOVA followed by Dunnett's test versus control, **P<0.01.
Figure 5
Figure 5
N-cadherin distribution in vivo. (A) A pair of neurons just generated in the SVZ (note the adjacent Tbr2-positive basal progenitors) show a crescent of N-cadherin GFP towards the CP. (B) Paraffin sections from Tubb3–mGFP mice were labelled with N-cadherin. Two examples are shown: the left picture shows the co-labelling of mGFP (new neuron), N-cadherin and DAPI (nucleus). The middle picture shows N-cadherin and DAPI with the outline of the GFP-positive cell drawn and the right picture the intensity of N-cadherin only in this GFP positive selected neuron. Scale bars=5 μm.
Figure 6
Figure 6
N-cadherin orients the cell axis and influences polarity in vivo. (A) Schematic representation of our measurement of cell axis orientation in the developing cortex. Radial direction is perpendicular to the VZ. The angle deviating from radial direction (θ=0) has been quantified in all experiments and displayed as frequency distributions. (B) In utero electroporation of the lateral ventricles of E14.5 mice with GFP control vectors, wt N-cadherin–GFP or dominant negative Δ390N-cadherin–GFP. Neurons exiting the SVZ are analysed. (C) Representative z-stack projections of neurons analysed in (B). The right upper panel shows neurons transfected with Δ390N-cadherin–GFP (E14.5–E16.5), which were pulse labelled for 11 h with BrDU. (D) Golgi orientation with respect to the radial direction of the same neurons as in (B). (E) Quantification of embryonic cortical neurons transfected with wt N-cadherin–GFP, dominant negative Δ390 N-cadherin–GFP or dt-Tomato (internal control) were grown on coronal cortical sections. (B, D, E) All insets: population distribution (***P<0.001, Kruskal–Wallis with Dunn's multiple comparison test control and wt versus Δ390). Scale bars=10 μm.

References

    1. Attardo A, Calegari F, Haubensak W, Wilsch-Brauninger M, Huttner WB (2008) Live imaging at the onset of cortical neurogenesis reveals differential appearance of the neuronal phenotype in apical versus basal progenitor progeny. PLoS One 3: e2388. - PMC - PubMed
    1. Banker G, Goslin K (1988) Developments in neuronal cell culture. Nature 336: 185–186 - PubMed
    1. Basto R, Lau J, Vinogradova T, Gardiol A, Woods CG, Khodjakov A, Raff JW (2006) Flies without centrioles. Cell 125: 1375–1386 - PubMed
    1. Chausovsky A, Bershadsky AD, Borisy GG (2000) Cadherin-mediated regulation of microtubule dynamics. Nat Cell Biol 2: 797–804 - PubMed
    1. Cowan CR, Hyman AA (2004) Centrosomes direct cell polarity independently of microtubule assembly in C. elegans embryos. Nature 431: 92–96 - PubMed

Publication types