. 2012 Mar;122(3):1052-65.
doi: 10.1172/JCI60282. Epub 2012 Feb 22.

Cdc42 and Rab8a are critical for intestinal stem cell division, survival, and differentiation in mice

Affiliations

Cdc42 and Rab8a are critical for intestinal stem cell division, survival, and differentiation in mice

Ryotaro Sakamori et al. J Clin Invest. 2012 Mar.

Abstract

The constant self renewal and differentiation of adult intestinal stem cells maintains a functional intestinal mucosa for a lifetime. However, the molecular mechanisms that regulate intestinal stem cell division and epithelial homeostasis are largely undefined. We report here that the small GTPases Cdc42 and Rab8a are critical regulators of these processes in mice. Conditional ablation of Cdc42 in the mouse intestinal epithelium resulted in the formation of large intracellular vacuolar structures containing microvilli (microvillus inclusion bodies) in epithelial enterocytes, a phenotype reminiscent of human microvillus inclusion disease (MVID), a devastating congenital intestinal disorder that results in severe nutrient deprivation. Further analysis revealed that Cdc42-deficient stem cells had cell division defects, reduced capacity for clonal expansion and differentiation into Paneth cells, and increased apoptosis. Cdc42 deficiency impaired Rab8a activation and its association with multiple effectors, and prevented trafficking of Rab8a vesicles to the midbody. This impeded cytokinesis, triggering crypt apoptosis and disrupting epithelial morphogenesis. Rab8a was also required for Cdc42-GTP activity in the intestinal epithelium, where continued cell division takes place. Furthermore, mice haploinsufficient for both Cdc42 and Rab8a in the intestine demonstrated abnormal crypt morphogenesis and epithelial transporter physiology, further supporting their functional interaction. These data suggest that defects of the stem cell niche can cause MVID. This hypothesis represents a conceptual departure from the conventional view of this disease, which has focused on the affected enterocytes, and suggests stem cell-based approaches could be beneficial to infants with this often lethal condition.


Figures
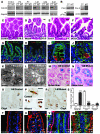
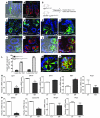
Figure 1
Figure 1. Cdc42 deficiency impairs intestinal epithelial morphogenesis.
(A) Western blots for Cdc42 using control (CT) and mutant (MT) intestinal lysates at the indicated stages. (B) Western blots for Pkcζ, pPkcζ, and Par3. (CF) H&E staining for control and mutant jejunums. (GJ) Immunofluorescence staining for lysozyme (red) and E-cadherin (green). Nuclei were labeled with DAPI (blue). Arrows in H indicate incorrectly localized lysozyme-positive cells in mutant villus epithelium. I and J show close-up images of the boxed regions in G and H, respectively. (K and L) TEM micrographs of 1-month-old (1-M) control and mutant jejunum crypts. (M and N) Alcian blue staining of 1-month-old control and mutant jejunum crypts. (OR) ChgA staining. Dotted lines in O and R indicate crypts. (S) Quantification of Alcian blue–positive (Alcian B+), Lys+ (lysozyme-positive), and ChgA+ cell numbers per crypt. (T and U) Immunofluorescence staining for AP. Arrows in U indicate AP-positive inclusion bodies. (V and W) Immunofluorescence staining for DBA, lectin, and E-cadherin. Arrows in W indicate the vacuolar structures in mutant epithelial cells. *P < 0.05; ***P < 0.001. Data are mean ± SEM. Scale bars: 10 μm (K and L), 2 μm (all other panels).
Figure 2
Figure 2. Cdc42 deficiency perturbs crypt homeostasis.
(A and B) Ki67 staining of control and mutant intestinal crypts. Arrows in A indicate putative cycling stem cells. (C and D) BrdU staining. Arrows in C indicate putative stem cells at S phase. Dotted lines in C and D indicate crypts. (E) Quantification of Ki67+, BrdU+, and pHH3+ cells per crypt. *P < 0.05; ***P < 0.001. (F and G) Immunofluorescence staining of pHH3 and E-cadherin. (H and I) TUNEL staining. Crypts are indicated by dotted lines. (J) Western blots for Olfm4 and lysozyme in total intestinal lysates. AU-PAGE analysis for Defa5. β-Actin served as a loading control. Scale bars: 5 μm.
Figure 3
Figure 3. Defective cell division and differentiation of Cdc42-deficient Lgr5 stem cells.
(A and B) Immunofluorescence staining for lysozyme and GFP in Cdc42L/L;Lgr5CreER–EGFP mouse crypts prior to tamoxifen treatment. Paneth cell granules are visible in A. L/L indicates LoxP/loxP. (C) Experimental schematic of tamoxifen-induced Cdc42 ablation in Lgr5 stem cells. (D and E) GFP staining of control and Cdc42-deficient intestinal crypts 1 week after tamoxifen administration. Arrows in E indicate clustered stem cells; arrowheads point to stem cells that are segregated from neighboring stem cells. (F and G) GFP staining 3 weeks after tamoxifen treatment. Clustered stem cells are indicated by arrows in G. Dotted line in G indicates a crypt. (HK) GFP and lysozyme staining for control and Cdc42-deficient intestinal crypts 3 weeks after tamoxifen administration. Short arrows in J indicate clustered stem cells losing their triangle shape. Long arrow points a large vacuole in the mutant crypt. Paneth cell granules are visible in control crypts in H, but not in Cdc42-deficient crypts in J. (L) Cdc42-deficient crypts show increased frequency of abnormal clustering of GFP+ Lgr5 stem cells. (M and N) Costaining for Pkcζ and GFP. Arrow in M points to apical Pkcζ staining. (O and P) Real-time RT-PCR analyses. Scale bars: 5 μm. *P < 0.05; **P < 0.01; ***P < 0.001.
Figure 4
Figure 4. Cdc42 deficiency reduces the clonal expansion capacity of Lgr5 stem cells.
(A) Experimental scheme for the genetic tracing experiments. (B and C) GFP and lysozyme staining for control and Cdc42-deficient crypts 2 weeks after tamoxifen treatment. Arrow in B points to cells (in yellow) positive for both GFP and lysozyme. (D and E) GFP and basement membrane staining for control and Cdc42-deficient crypts 3 weeks after tamoxifen treatment. Arrows in E point to small clusters of cells derived from Cdc42-deficient stem cells. Schematic diagrams at the right of each panel summarize the results shown at left. (F) Quantification of RosaYFP-labeled villus epithelial cells derived from control and Cdc42-deficient Lgr5 stem cells 3 weeks after tamoxifen administration. ***P < 0.001. (GL) GFP and basement membrane staining illustrate columnar shapes of labeled control intestinal epithelial cells (arrows in G) but abnormal morphology of labeled Cdc42-deficient cells (arrows in J). Arrowheads in H and K indicate positively labeled villus epithelial cells. White arrowheads in I and L indicate normal nuclear alignment. Yellow arrowheads in L indicate disrupted nuclear organization and cell polarity in villus cells derived from Cdc42-deficient stem cells. (M and N) Costaining of pHH3 and GFP. Dotted line in M indicates an unlabeled crypt. Dotted lines in N encircle the wild-type crypts that escaped Cre recombination. Arrows in M and N indicate GFP+/pHH3+ cells. Scale bars: 5 μm.
Figure 5
Figure 5. Cdc42-deficient enterocytes develop microvillus inclusions.
TEM micrographs of control and Cdc42-mutant intestines at the indicated ages. Arrows in B, C, and E indicate microvillus inclusion bodies. Scale bars: 2 μm (AC and E), 500 nm (D, F, and H), 100 nm (G).
Figure 6
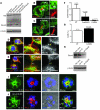
Figure 6. Cdc42 deficiency impairs Rab8a activation.
(A) Western blots for Rab8a, Rab11a, and Rabin8. (B) GST-JFC1 pull-down assay followed by Western blots for Rab8a showed significantly lower Rab8a-GTP levels in 1-month-old and 3-month-old mutant intestines. NS, non-specific bands. **P < 0.01. (C) Co-IP for Sec8 and Rab8a demonstrated reduced association of Rab8a with exocyst. (D) In 3-week-old Rab8–/– intestine, total Cdc42, Cdc42-GTP, and pPkcζ levels were reduced compared with control intestine. Western blot results represent at least 3 independent experiments.
Figure 7
Figure 7. Cdc42 depletion affects midbody trafficking of Rab8a vesicle and cytokinesis.
(A) Western blots confirmed Cdc42 knockdown by siRNA in Hela cells. (B and C) Live cell imaging showed that Rab8a-GFP (green) trafficked to the mcherry-tubulin–labeled midbody (red) during early cytokinesis in control cells but not in Cdc42-depleted cells. Arrows in B indicate enriched Rab8a at control midbody. Arrowhead in C indicates less Rab8a protein at midbody of Cdc42-depleted cells. (D and E) Rab8a-GFP localizes to the midbody (arrows in D) during late cytokinesis in control cells but not in Cdc42-depleted cells (arrowheads in E). (F) Quantification of cytokinesis in cells transfected with control siRNA, Cdc42 siRNA (Cdc42KD), and cells treated with 7 μM CASIN. (G) FACS cell cycle analyses of CASIN-treated cells showed accumulation at the G2/M phase. (H) Western blots confirmed Cdc42 knockdown in Caco2 cells by a lentiviral shRNA particle. (I and J) Rab8a and Pkcζ staining for control and Cdc42 knockdown Caco2 cysts. Arrowheads in J indicate large vacuoles where Rab8a was localized. Scale bars: 10 μm. *P < 0.05; **P < 0.01.
Figure 8
Figure 8. Cdc42 and Rab8a double heterozygous mice show abnormal crypt morphology and epithelial uptake.
(AD) TEM micrographs of control and double heterozygous crypts. Scale bars: 10 μm (AC); 500 nm (D). (EG) Intestinal transporter uptake assays for glucose, proline, and carnosine. *P < 0.05 compared with wild type; #P < 0.05 compared with wild type and single heterozygous; **P < 0.01 compared with wild type. (H) A model depicting the coordination of Cdc42 and Rab8a during intestinal stem cell division and epithelial morphogenesis. Cdc42, Rab8a, and Myo5B are shown in red to indicate their association with MVID. The exocyst, an octameric protein complex of Sec3, Sec5, Sec6, Sec8, Sec10, Sec15, Exo70, and Exo84, is indicated as blue circles at midbody.

Similar articles

Cited by

References

    1. Lake BD. Microvillus inclusion disease: specific diagnostic features shown by alkaline phosphatase histochemistry. J Clin Pathol. 1988;41(8):880–882. doi: 10.1136/jcp.41.8.880. - DOI - PMC - PubMed
    1. Muller T, et al. MYO5B mutations cause microvillus inclusion disease and disrupt epithelial cell polarity. Nat Genet. 2008;40(10):1163–1165. doi: 10.1038/ng.225. - DOI - PubMed
    1. Roland JT, Bryant DM, Datta A, Itzen A, Mostov KE, Goldenring JR. Rab GTPase-Myo5B complexes control membrane recycling and epithelial polarization. Proc Natl Acad Sci U S A. 2011;108(7):2789–2794. doi: 10.1073/pnas.1010754108. - DOI - PMC - PubMed
    1. Sato T, et al. The Rab8 GTPase regulates apical protein localization in intestinal cells. Nature. 2007;448(7151):366–369. doi: 10.1038/nature05929. - DOI - PubMed
    1. Chavrier P, Vingron M, Sander C, Simons K, Zerial M. Molecular cloning of YPT1/SEC4-related cDNAs from an epithelial cell line. Mol Cell Biol. 1990;10(12):6578–6585. - PMC - PubMed

Publication types