

In vivo pharmacokinetics/pharmacodynamics of colistin and imipenem in Pseudomonas aeruginosa biofilm infection
- PMID: 22354300
- PMCID: PMC3346607
- DOI: 10.1128/AAC.06486-11
In vivo pharmacokinetics/pharmacodynamics of colistin and imipenem in Pseudomonas aeruginosa biofilm infection
Abstract
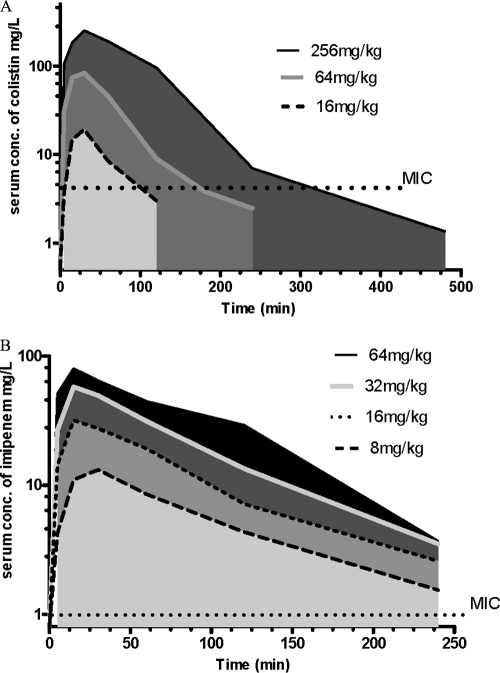
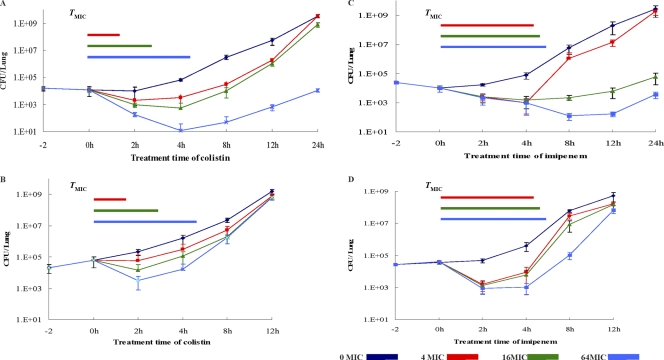
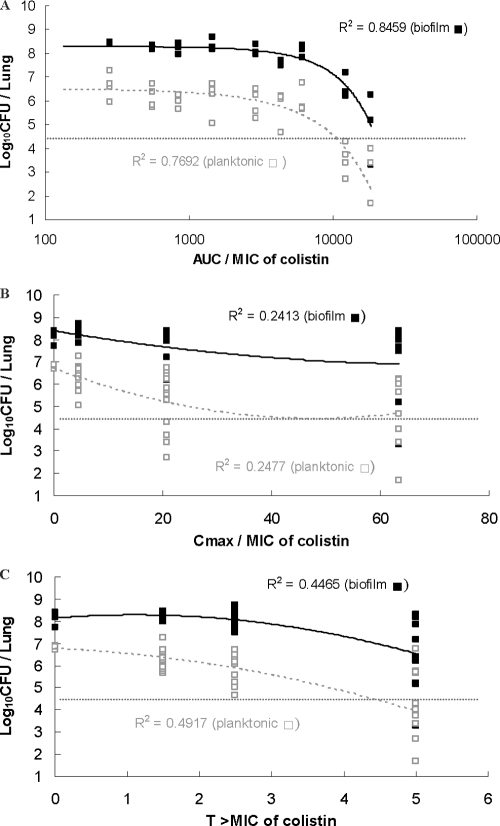
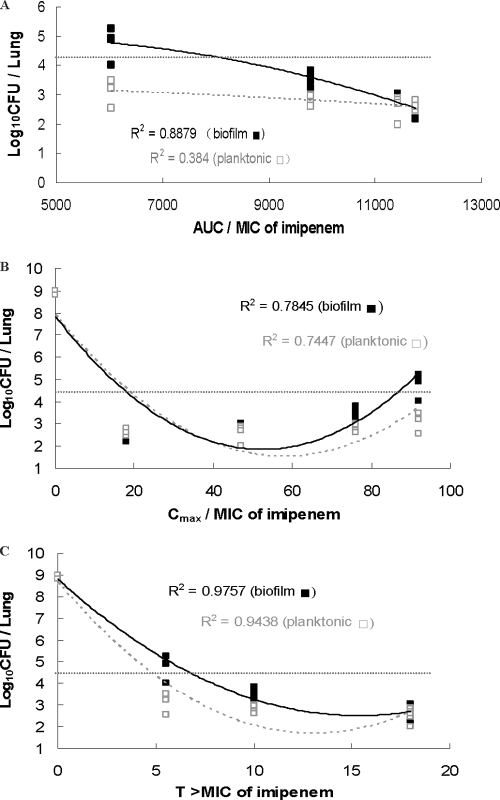
Many Pseudomonas aeruginosa isolates from the airways of patients with cystic fibrosis (CF) are sensitive to antibiotics in susceptibility testing, but eradication of the infection is difficult. The main reason is the biofilm formation in the airways of patients with CF. The pharmacokinetics (PKs) and pharmacodynamics (PDs) of antimicrobials can reliably be used to predict whether antimicrobial regimens will achieve the maximum bactericidal effect against infections. Unfortunately, however, most PK/PD studies of antimicrobials have been done on planktonic cells and very few PK/PD studies have been done on biofilms, partly due to the lack of suitable models in vivo. In the present study, a biofilm lung infection model was developed to provide an objective and quantitative evaluation of the PK/PD profile of antimicrobials. Killing curves were set up to detect the antimicrobial kinetics on planktonic and biofilm P. aeruginosa cells in vivo. Colistin showed concentration-dependent killing, while imipenem showed time-dependent killing on both planktonic and biofilm P. aeruginosa cells in vivo. The parameter best correlated to the elimination of bacteria in lung by colistin was the area under the curve (AUC) versus MIC (AUC/MIC) for planktonic cells or the AUC versus minimal biofilm inhibitory concentration (MBIC; AUC/MBIC) for biofilm cells. The best-correlated parameter for imipenem was the time that the drug concentration was above the MIC for planktonic cells (T(MIC)) or time that the drug concentration was above the MBIC (T(MBIC)) for biofilm cells. However, the AUC/MIC of imipenem showed a better correlation with the efficacy of imipenem for biofilm infections (R(2) = 0.89) than planktonic cell infections (R(2) = 0.38). The postantibiotic effect (PAE) of colistin and imipenem was shorter in biofilm infections than planktonic cell infections in this model.
Figures
References
-
- Amsterdam D. 2005. Susceptibility testing of antimicrobials in liquid media, p 61–143 In Lorian V. (ed), Antibiotics in laboratory medicine, 5th ed Lippincott Williams & Wilkins, Philadelphia, PA
-
- Andes D, Craig WA. 2002. Animal model pharmacokinetics and pharmacodynamics: a critical review. Int. J. Antimicrob. Agents 19:261–268 - PubMed
Publication types
MeSH terms
Substances
LinkOut - more resources
Full Text Sources
Other Literature Sources
Medical
Molecular Biology Databases
Miscellaneous
