. 2012 Apr;9(2):446-63.
doi: 10.1007/s13311-012-0103-3.

Recovery of MERRF fibroblasts and cybrids pathophysiology by coenzyme Q10

Affiliations

Recovery of MERRF fibroblasts and cybrids pathophysiology by coenzyme Q10

Mario De la Mata et al. Neurotherapeutics. 2012 Apr.

Abstract

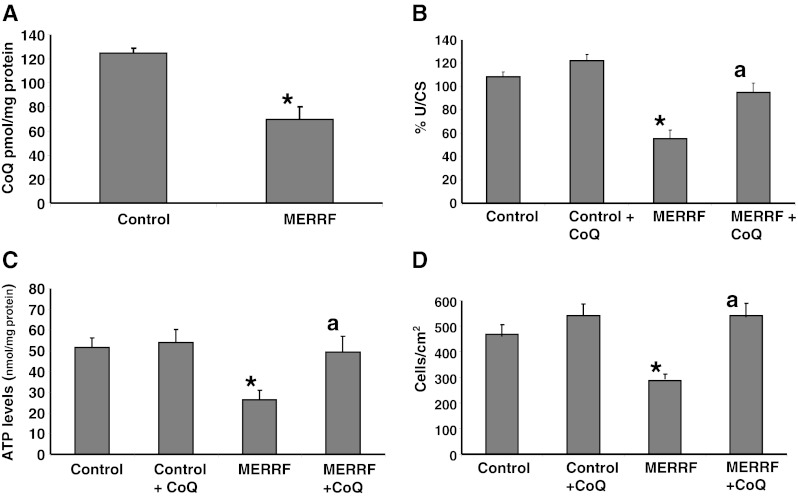
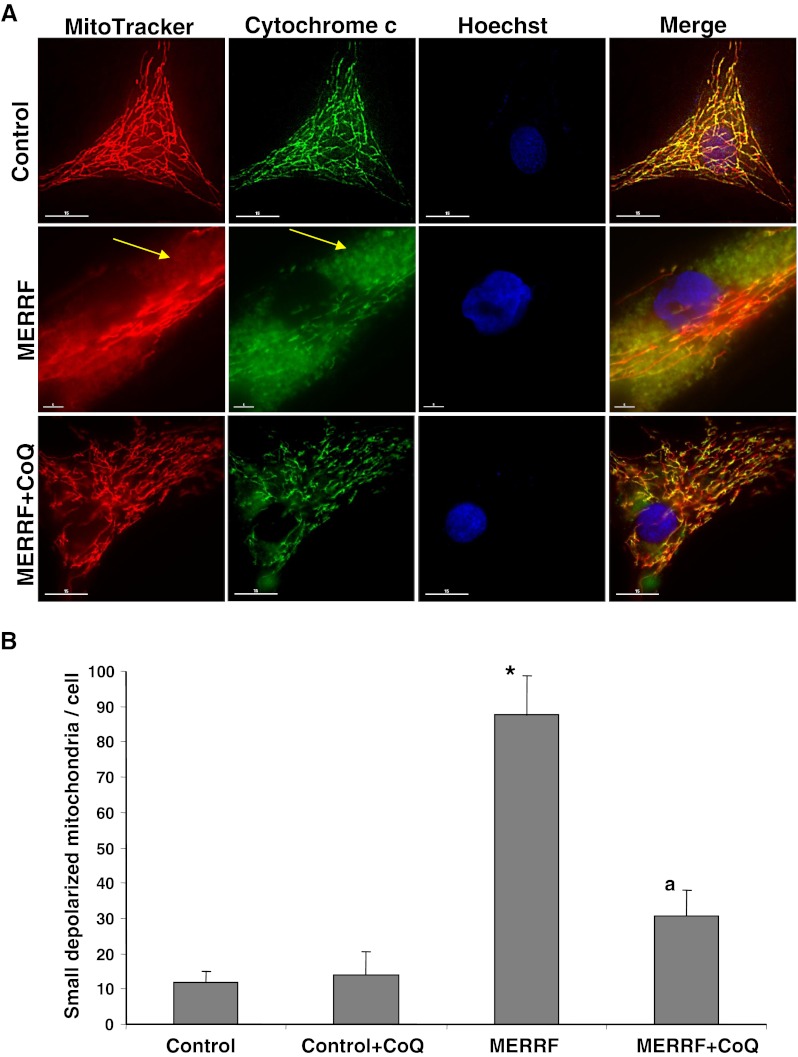
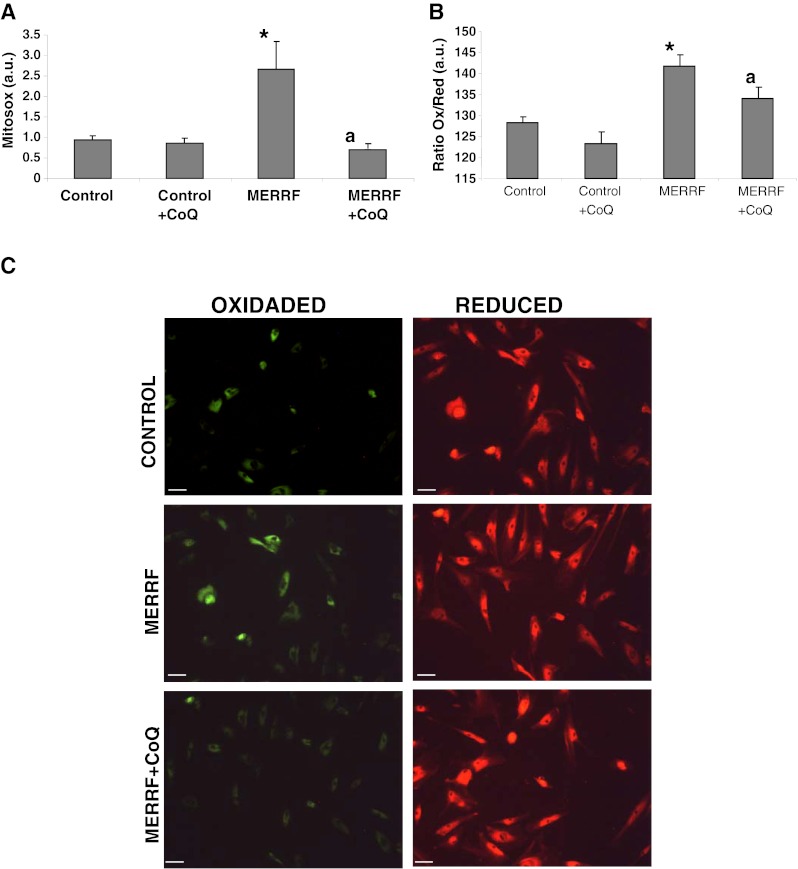
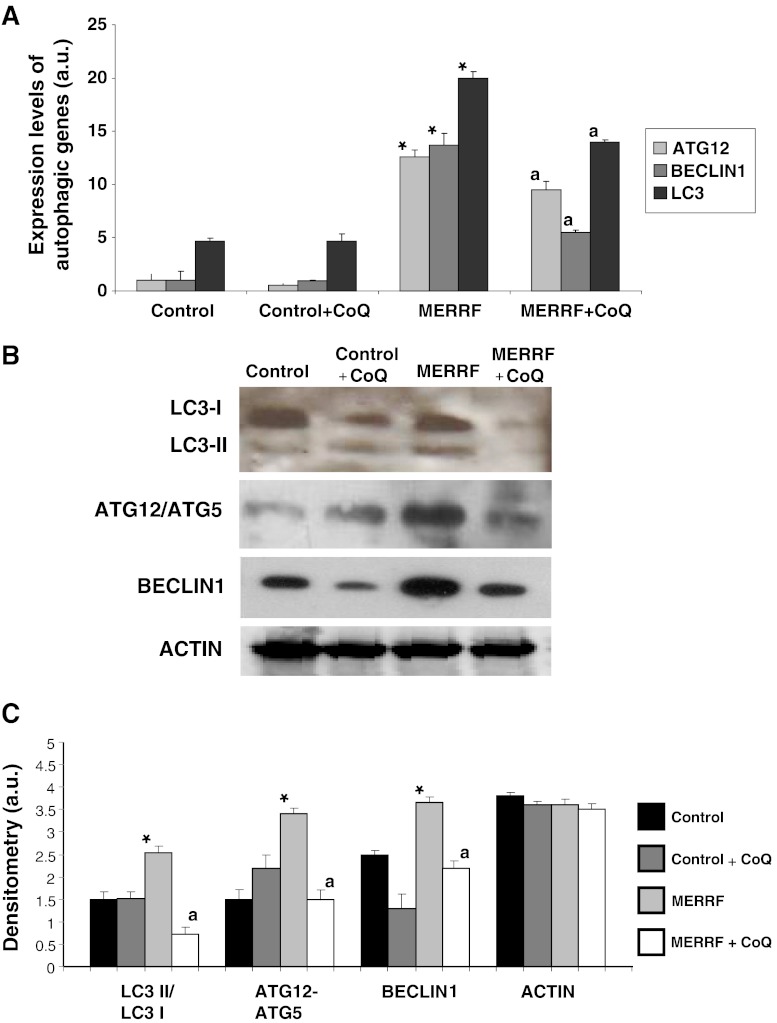
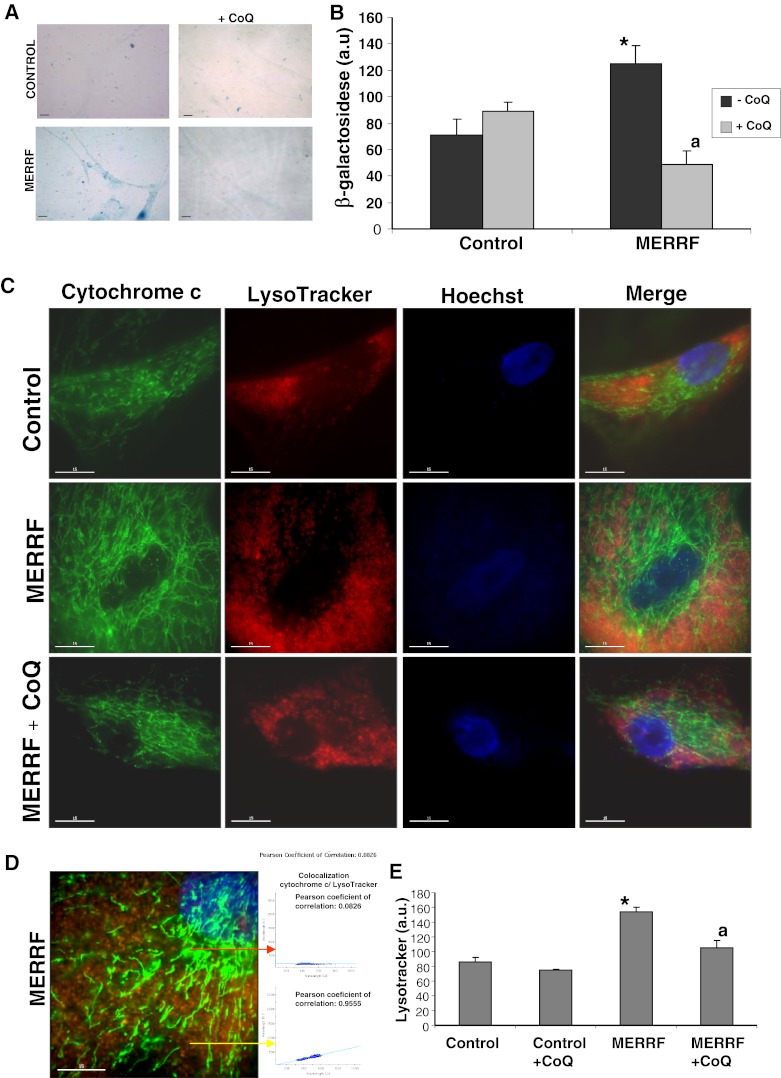
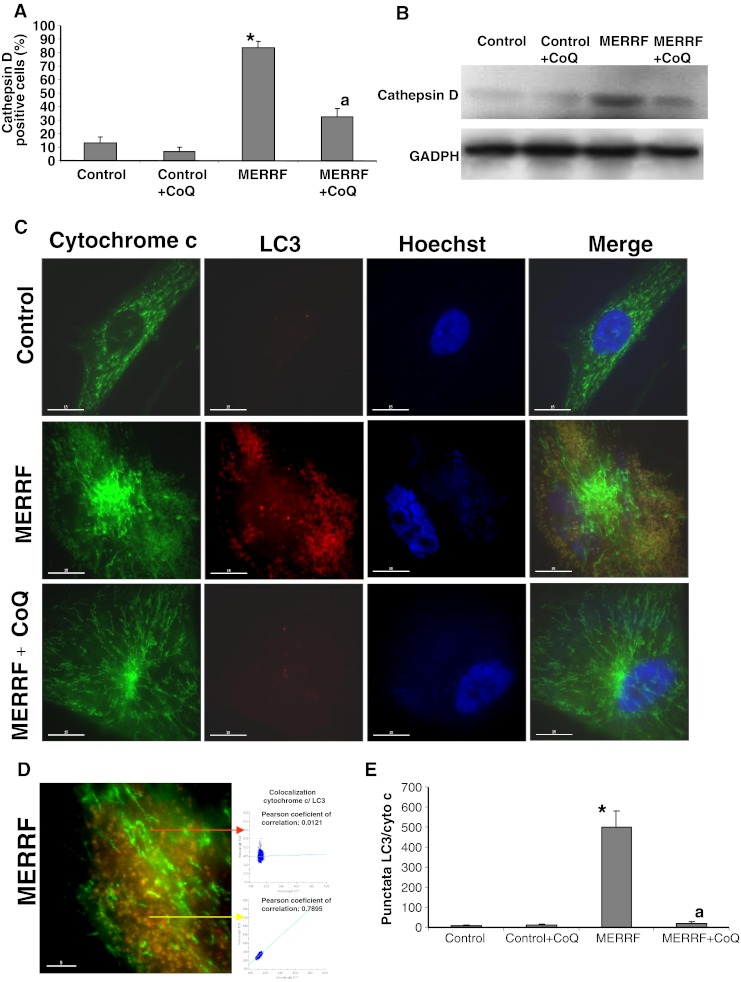
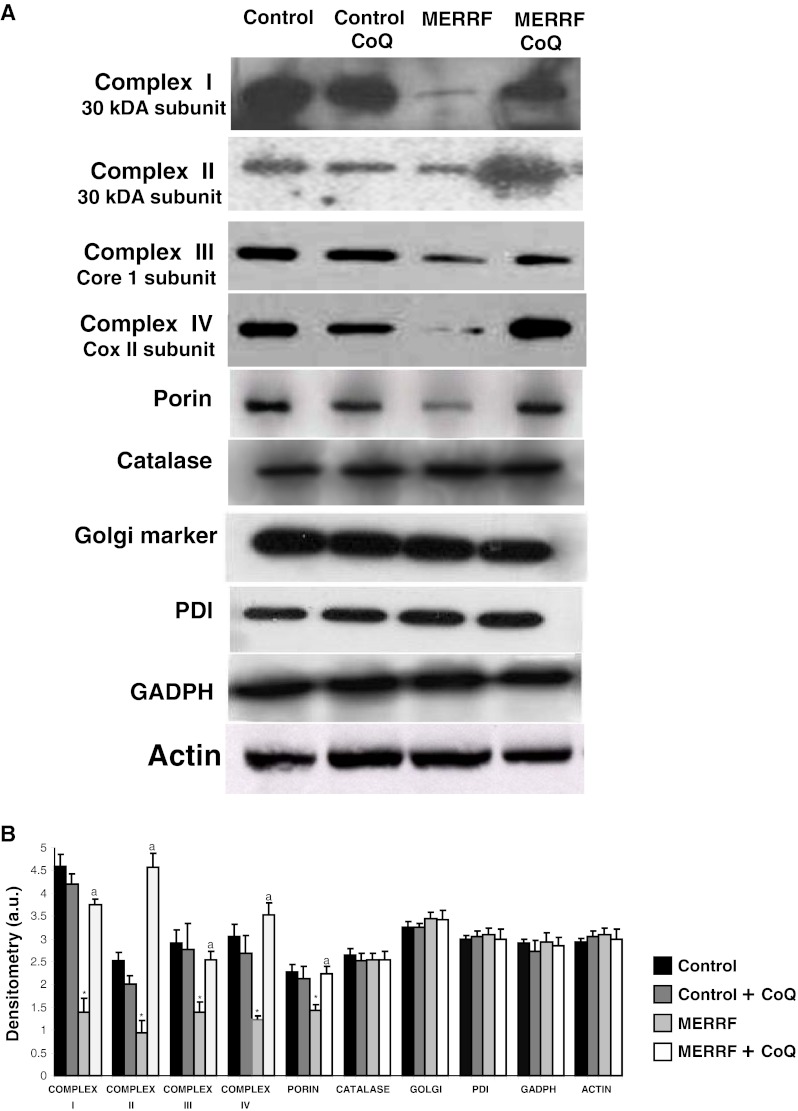
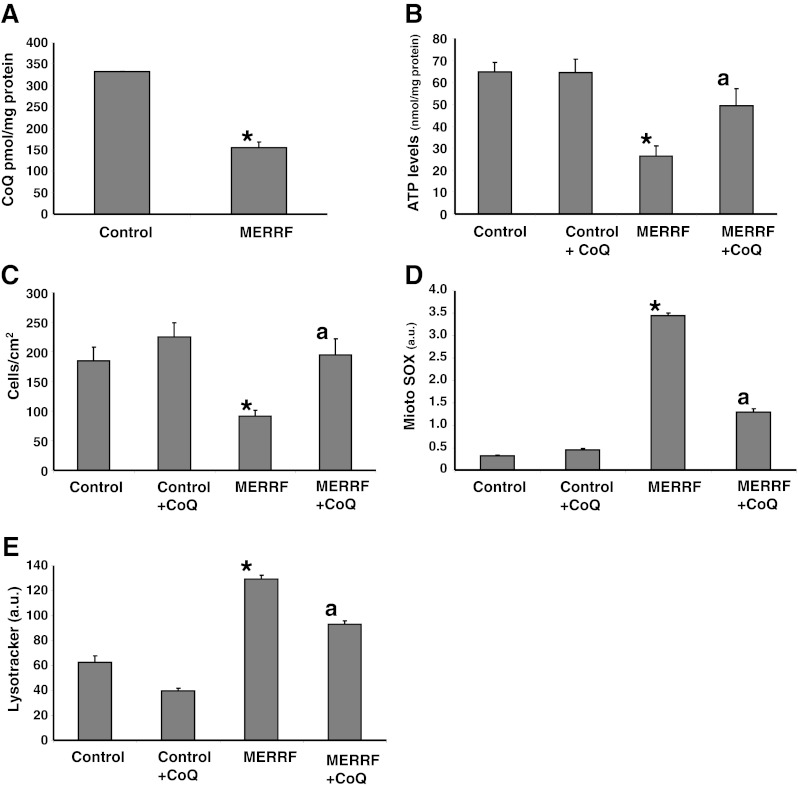
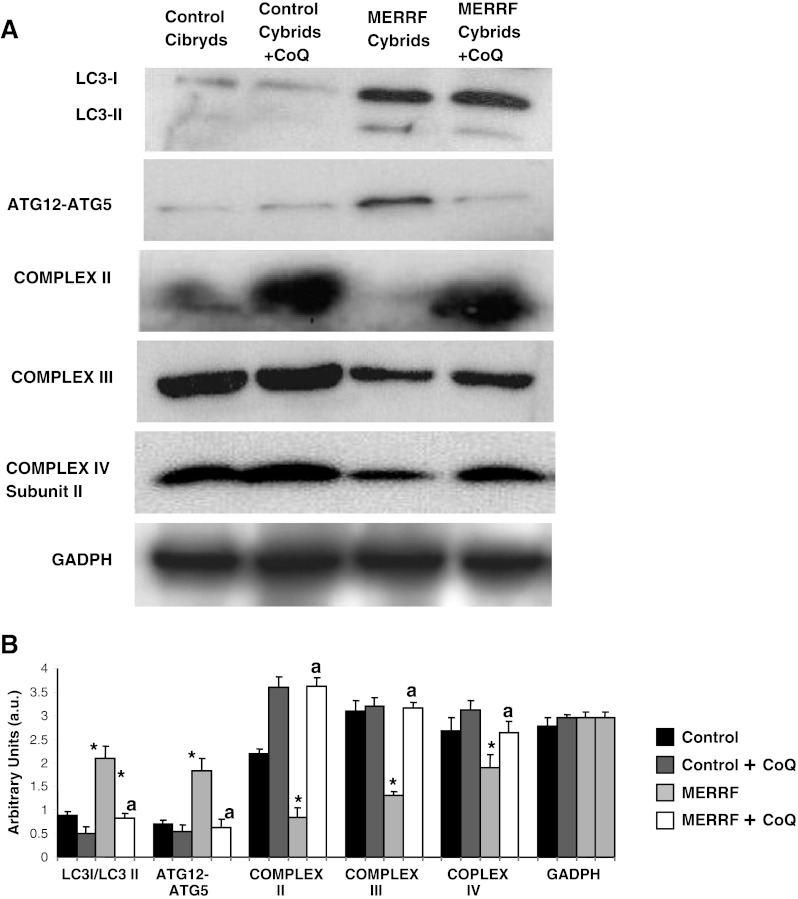
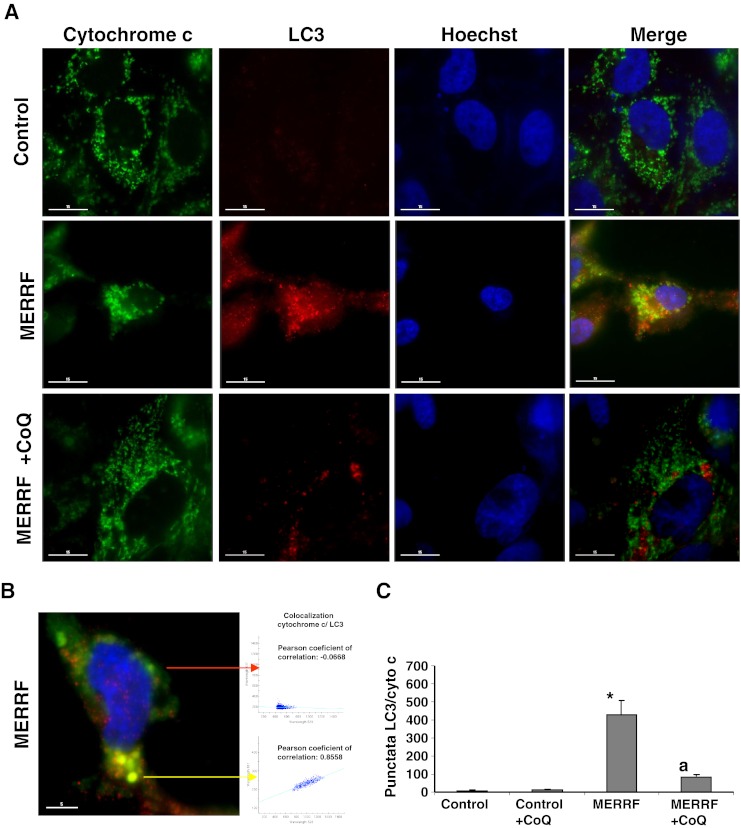
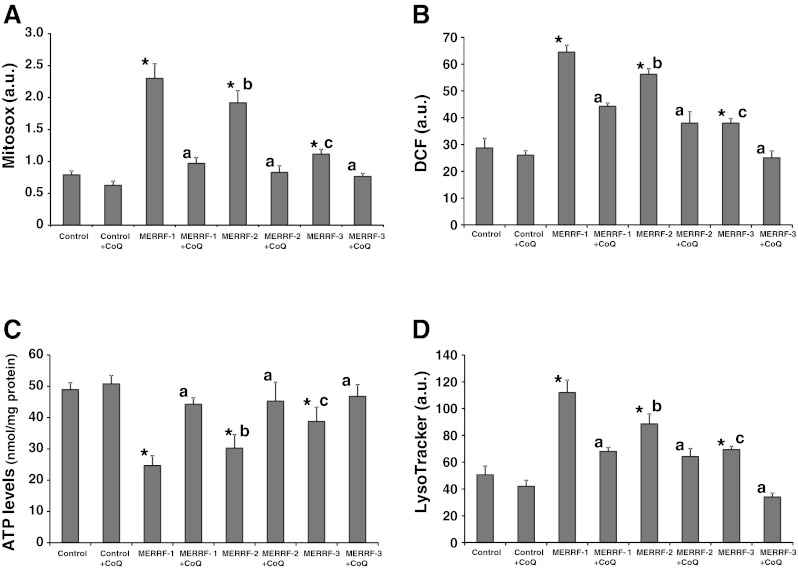
Mitochondrial DNA mutations are an important cause of human disease for which there is no effective treatment. Myoclonic epilepsy with ragged-red fibers (MERRF) is a mitochondrial disease usually caused by point mutations in transfer RNA genes encoded by mitochondrial DNA. The most common mutation associated with MERRF syndrome, m.8344A > G in the gene MT-TK, which encodes transfer RNA(Lysine), affects the translation of all mitochondrial DNA encoded proteins. This impairs the assembly of the electron transport chain complexes leading to decreased mitochondrial respiratory function. Here we report on how this mutation affects mitochondrial function in primary fibroblast cultures established from patients harboring the A8344G mutation. Coenzyme Q10 levels, as well as mitochondrial respiratory chain activity, and mitochondrial protein expression levels were significantly decreased in MERRF fibroblasts. Mitotracker staining and imaging analysis of individual mitochondria indicated the presence of small, rounded, depolarized mitochondria in MERRF fibroblasts. Mitochondrial dysfunction was associated with increased oxidative stress and increased degradation of impaired mitochondria by mitophagy. Transmitochondrial cybrids harboring the A8344G mutation also showed CoQ10 deficiency, mitochondrial dysfunction, and increased mitophagy activity. All these abnormalities in patient-derived fibroblasts and cybrids were partially restored by CoQ10 supplementation, indicating that these cell culture models may be suitable for screening and validation of novel drug candidates for MERRF disease.


Figures

Fig. 1
Fig. 1
Mitochondrial function in myoclonic epilepsy with ragged-red fibers (MERRF) fibroblasts. (A) Coenzyme Q10 (CoQ) levels in control and MERRF fibroblasts. (B) Complex I + III, activity measured in cells grown in the presence or absence of CoQ (100 μM) for 72 h. Results (mean ± SD) are expressed in units per citrate synthase (U/CS). (C) Adenosine-5'-triphosphate (ATP) levels in control and MERRF fibroblasts grown in the absence or presence of CoQ (100 μM) for 72 h. (D) Cell proliferation of control and MERRF fibroblasts cultured in the absence or presence of CoQ (100 μM) for 72 h. Data represent the mean ± SD of 3 separate experiments. *p < 0.01 between control and MERRF fibroblasts. ap < 0.05 between the presence and the absence of CoQ
Fig. 2
Fig. 2
Mitochondrial membrane potential. (A) Representative images of MitoTracker and cytochrome c staining in control and myoclonic epilepsy with ragged-red fibers (MERRF) fibroblasts cultured in the presence or absence of coenzyme Q10 (CoQ) (100 μM). Yellow arrows indicate small depolarized mitochondria. (B) Quantification of depolarized mitochondria by fluorescence imaging analysis in 50 randomly selected cells from control and MERRF cultures. Mitochondrial specificity of MitoTracker staining was assessed by examining colocalization of MitoTracker fluorescence with cytochrome c. Scale bar = 15 μm. *p < 0.01 between control and MERRF fibroblasts. ap < 0.05 between the presence and the absence of CoQ.
Fig. 3
Fig. 3
Mitochondrial reactive oxygen species (ROS) generation and lipid peroxidation in myoclonic epilepsy with ragged-red fibers (MERRF) fibroblasts. (A) Mitochondrial ROS generation in fibroblasts cultured for 72 h in normal growth medium or medium supplemented with coenzyme Q10 (CoQ) (100 μM) prior to analysis. Results are expressed as the ratio of MitoSOX signal to 10-N-nonyl acridine orange signal. The mean ± SD of 3 independent experiments are shown. (B) Quantification of lipid peroxidation in control and MERRF fibroblasts in the presence or absence of CoQ (100 μM) for 72 h. Data represent the ratio oxidized lipid/reduced lipid. (C) C11-Bodipy staining. Red fluorescence represents nonoxidized lipids, and green fluorescence represents oxidized lipids. Scale bar = 30 μm. For the control cells, the data are the mean ± SD for experiments on 2 different control cells. Data represent the mean ± SD of 3 separate experiments. *p < 0.01 between control and MERRF fibroblasts. ap < 0.01, between the presence and the absence of CoQ. a.u. = arbitrary units
Fig. 4
Fig. 4
Expression of autophagic proteins. (A) The expression levels of ATG12, BECLIN1, and LC3 mRNA in control and myoclonic epilepsy with ragged-red fibers (MERRF) fibroblasts measured by real time polymerase chain reaction. (B) The amount of LC3-I (upper band) and LC3-II (lower band), ATG12 and BECLIN1 protein were determined in the control and MERRF fibroblast cultures by Western blotting. The ATG12 band represents the Atg12-Atg5 conjugated form. Fibroblast cultures were grown in normal culture medium or in medium supplemented with coenzyme Q10 (CoQ) (100 μM) for 72 h. Actin was used as a loading control. (C) The amount of various proteins estimated by densitometry. Actin was used as a loading control. For the control cells, the data are the mean ± SD for experiments on 2 different control cell lines. Data, expressed as arbitrary units (a.u.) represent the mean ± SD of 3 separate experiments. *p < 0.01 between control and MERRF fibroblasts. ap < 0.01, between the presence and the absence of coenzyme Q10 (CoQ).
Fig. 5
Fig. 5
Autophagic markers in myoclonic epilepsy with ragged-red fibers (MERRF) and control fibroblasts. (A) Representative images of β-galactosidase staining in control and patient fibroblasts, visualized by light microscopy. Cells were cultured in normal medium or in the presence of coenzyme Q10 (CoQ) (100 μM) for 72 h. Scale bar = 15 μm. (B) β-galactosidase staining of control and MERRF fibroblast cultures quantified using ImageJ software. (C) LysoTracker staining in control and MERRF fibroblasts visualized by fluorescence microscopy. The effect of CoQ supplementation (100 μM) for 72 h was also evaluated. Scale bar = 15 μm. (D) Magnification of a small area in a MERRF fibroblast. Arrows show autophagolysosomes with LysoTracker and cytochrome c colocalization. The colocalization of both markers was assessed by DeltaVision software (Applied Precision, Issaquah, WA) calculating the Pearson coefficient of correlation. Scale bar = 15 μm. (E) Quantification of acidic vacuoles in control and patient fibroblast by LysoTracker staining and flow cytometry analysis. Cells were cultured in the presence or absence of CoQ, as in (B). Results are expressed in arbitrary units (a.u.). For the control cells, the data are the mean ± SD for experiments conducted on 2 different control cell lines. Data represent the mean ± SD of 3 separate experiments. *p < 0.01 between control and MERRF fibroblasts. ap < 0.01 between the presence and the absence of CoQ
Fig. 6
Fig. 6
Expression of lysosomal and autophagosome markers in myoclonic epilepsy with ragged-red fibers (MERRF) and control fibroblasts. (A) Quantification of cathepsin positive cells in control and MERRF cells cultured with or without coenzyme Q10 (CoQ) supplementation (100 μM for 72 h). Cathepsin D staining was visualized by fluorescence microscopy. (B) The amount of cathepsin D protein determined in control and MERRF fibroblast cultures by Western blotting control and MERRF fibroblast cultures were grown in normal culture medium or in medium supplemented with CoQ (100 μM) for 72 h. Actin was used as a loading control. *p < 0.01 between control and MERRF fibroblasts. ap < 0.01 between the presence and the absence of CoQ. (C) Image analysis of LC3 and cytochrome c immunostained control and MERRF fibroblasts. Cells were fixed and immunostained with anti-LC3 (autophagosome marker) and cytochrome c (mitochondrial marker) and examined by fluorescence microscopy. Colocalization of both markers was assessed using DeltaVision software (Applied Precision, Issaquah, WA). (D) Magnification of a small area in a MERRF fibroblast. Arrows show autophagosomes with LC3 and cytochrome c colocalization. The colocalization of both markers was assessed by the DeltaVision software (Applied Precision) calculating the Pearson coefficient of correlation. Scale bar = 5 μm. (E) Quantification of LC3/cytochrome c puntacta in control and MERRF fibroblasts incubated with or without 100 μM CoQ (n = 100 cells). *p < 0.01 between control and MERRF fibroblasts. ap < 0.01, between the presence and the absence of CoQ. GADPH = glyceraldehyde 3-phosphate dehydrogenase
Fig. 7
Fig. 7
Mitophagy in myoclonic epilepsy with ragged-red fibers (MERRF) fibroblasts. (A) Western blot analysis of mitochondrial proteins of complex I (30 kDa subunit), complex II (30 kDa subunit), complex III (core 1 subunit), complex IV (COX II subunit), and porin-, Golgi (Golgi marker), endoplasmic reticulum (PDI), and peroxisome (catalase) proteins in MERRF fibroblasts. Fibroblast protein extracts (50 μg) were separated on a 12.5% sodium dodecyl sulfate polyacrylamide gel and immunostained with antibodies against porin, cytochrome c, catalase, PDI, and Golgi marker. Glyceraldehyde 3-phosphate dehydrogenase (GADPH) and actin were used as loading control. (B) Densitometry of Western blotting was performed using the ImageJ software. Data, expressed as arbitrary units (a.u.), represent the mean ± SD of 3 separate experiments. *p < 0.01 between control and MERRF fibroblasts. ap < 0.01, between the presence and the absence of coenzyme Q10 (CoQ)
Fig. 8
Fig. 8
Coenzyme Q10 (CoQ) levels, adenosine-5'-triphosphate (ATP) levels, rate of cellular proliferation, mitochondrial reactive oxygen species (ROS) production, and lysosomal mass in transmitochondrial cybrids. (A) CoQ levels, (B) ATP content, (C) cellular proliferation rate, (D) mitochondrial ROS production, and (E) quantification of acidic vacuoles in control and mutant transmitocondrial cybrids expressing high levels of the m.8344A > G mutation. Cells were grown in the presence or absence of CoQ (100 μM for 72 h). Data represent the mean ± SD of 3 separate experiments arbitrary units (a.u.). *p < 0.01 between control and mutant cybrids. ap < 0.01 between the presence and the absence of CoQ. MERRF = myoclonic epilepsy with ragged-red fibers
Fig. 9
Fig. 9
Western blot analysis of autophagic and mitochondrial proteins in myoclonic epilepsy with ragged-red fibers (MERRF) cybrids. (A) Western blot analysis of cybrids grown in normal culture medium or in medium supplemented with coenzyme Q10 (CoQ) (100 μM) for 72 h prior to analysis. Cybrid protein extracts (50 μg) were separated on a 12.5% SDS polyacrylamide gel and immunostained with antibodies against LC3, ATG12, complex III (core 1 subunit) and complex II (30 kDa subunit). Glyceraldehyde 3-phosphate dehydrogenase (GADPH) was used as a loading control. (B) Densitometry of Western blot performed using ImageJ software arbitrary units (a.u.). For control cells, the data are the mean ± SD for experiments on 2 different control cell lines. Data, expressed as a.u., represent the mean ± SD of 3 separate experiments. *p < 0.01, between control and mutant cybrids. ap < 0.01 between the presence and the absence of CoQ
Fig. 10
Fig. 10
Image analysis of LC3 and cytochrome c immunostained control and myoclonic epilepsy with ragged-red fibers (MERRF) cybrids. (A) Fluorescent analysis of control and MERRF cybrids immunostained with anti-LC3 (autophagosome marker) and cytochrome c (mitochondrial marker) Colocalization of both markers was assessed by the DeltaVision software (Applied Precision, Issaquah, WA). (B) Magnification of a small area in a MERRF cybrid cell. Arrows show autophagolysosomes with LC3 and cytochrome c colocalization. The colocalization of both markers was assessed using DeltaVision software (Applied Precision). (C) Quantification of LC3/cytochrome c puntacta in control and MERRF cybrids incubated with or without 100 μM coenzyme Q10 (CoQ) (n = 100 cells). *p < 0.01 between control and mutant cybrids. ap < 0.01 between the presence and the absence of CoQ
Fig. 11
Fig. 11
Effect of coenzyme Q10 (CoQ) supplementation in reactive oxygen species (ROS) levels, adenosine-5'-triphosphate (ATP) levels and LysoTracker staining, and in fibroblasts cell lines derived from 2 additional myoclonic epilepsy with ragged-red fibers (MERRF) patients. (A) Mitochondrial ROS generation in control and MERRF fibroblasts (MERRF-1, MERRF-2, and MERRF-3) cultured for 72 h in normal growth medium or medium supplemented with CoQ (100 μM) prior to analysis. Results are expressed as the ratio of MitoSOX signal to NAO signal. (B) H202 levels in control and MERRF fibroblasts cultured for 72 h in normal growth medium or medium supplemented with CoQ (100 μM) prior to analysis. H202 levels were measured using CMH2-DCFDA and flow cytometry analysis, as described (see “Material and Methods” for details). (C) ATP levels in control and MERRF fibroblasts grown in the absence or presence of CoQ (100 μM) for 72 h. (D) Quantification of acidic vacuoles in control and MERRF fibroblasts by LysoTracker staining and flow cytometry analysis. Cells were cultured in the presence or absence of 100 μM CoQ. For the control cells, the data are the mean ± SD for experiments conducted on 2 different control cell lines. Data represent the mean ± SD of 3 separate experiments arbitrary units (a.u.). *p < 0.01 between control and MERRF fibroblasts. ap < 0.01 between the presence and the absence of CoQ. bp < 0.01 between MERRF-2 and MERRF-1 fibroblasts. cp < 0.01 between MERRF-3 and MERRF-2 fibroblasts. DCF=Dichlorofluorescein

Similar articles

Cited by

References

    1. Wallace DC. Mitochondrial DNA sequence variation in human evolution and disease. Proc Natl Acad Sci U S A. 1994;91:8739–8746. doi: 10.1073/pnas.91.19.8739. - DOI - PMC - PubMed
    1. Shoffner JM, Lott MT, Lezza AM, et al. Myoclonic epilepsy and ragged-red fiber disease (MERRF) is associated with a mitochondrial DNA tRNA(Lys) mutation. Cell. 1990;61:931–937. doi: 10.1016/0092-8674(90)90059-N. - DOI - PubMed
    1. Erol I, Alehan F, Horvath R, et al. Demyelinating disease of central and peripheral nervous systems associated with a A8344G mutation in tRNALys. Neuromuscul Disord. 2009;19:275–278. doi: 10.1016/j.nmd.2009.01.012. - DOI - PubMed
    1. Wallace DC, Zheng XX, Lott MT, et al. Familial mitochondrial encephalomyopathy (MERRF): genetic, pathophysiological, and biochemical characterization of a mitochondrial DNA disease. Cell. 1988;55:601–610. doi: 10.1016/0092-8674(88)90218-8. - DOI - PubMed
    1. Ozawa M, Goto Y, Sakuta R, et al. The 8,344 mutation in mitochondrial DNA: a comparison between the proportion of mutant DNA and clinico-pathologic findings. Neuromuscul Disord. 1995;5:483–488. doi: 10.1016/0960-8966(95)00009-C. - DOI - PubMed

Publication types