. 2012 Apr 6;287(15):11769-77.
doi: 10.1074/jbc.M111.325027. Epub 2012 Feb 21.

Anti-oncogenic microRNA-203 induces senescence by targeting E2F3 protein in human melanoma cells

Affiliations

Anti-oncogenic microRNA-203 induces senescence by targeting E2F3 protein in human melanoma cells

Shunsuke Noguchi et al. J Biol Chem. .

Abstract

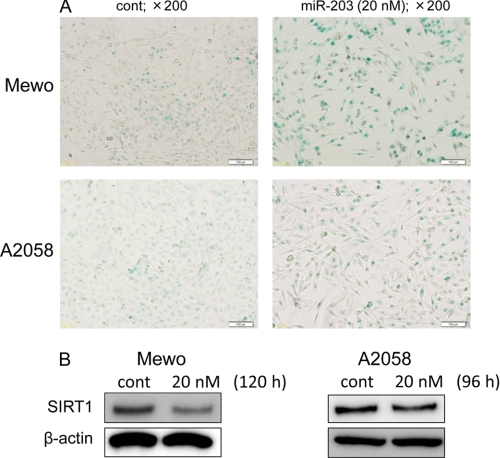
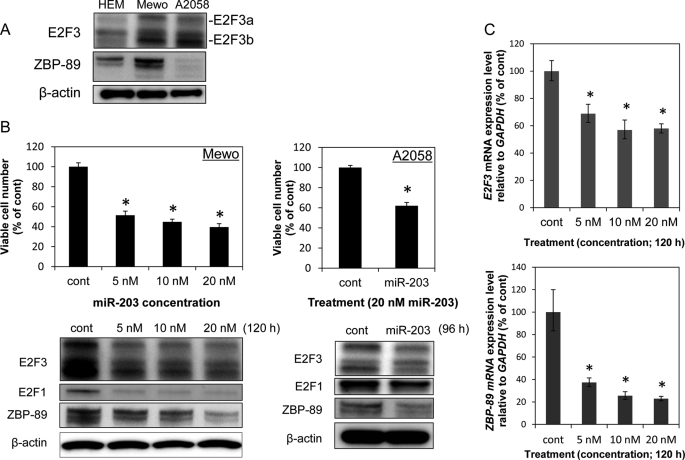
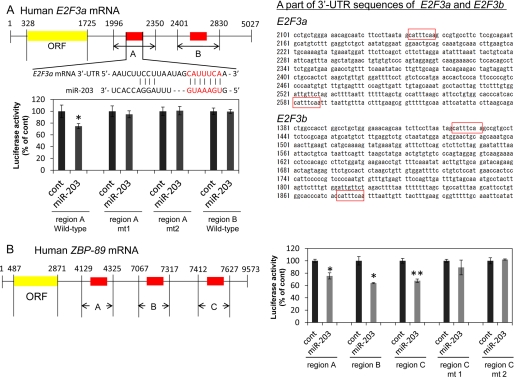
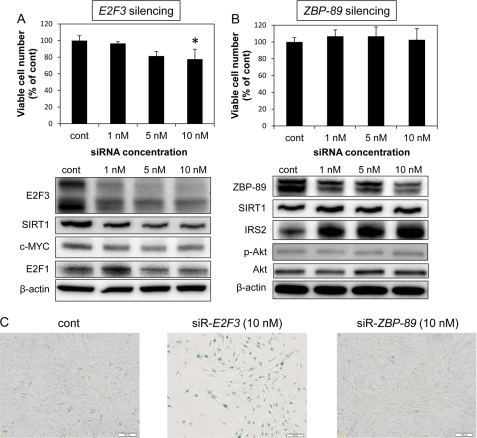
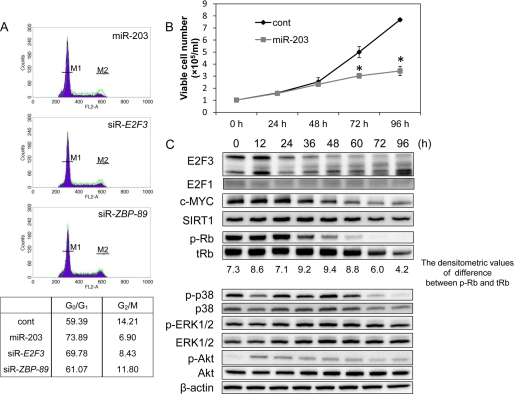
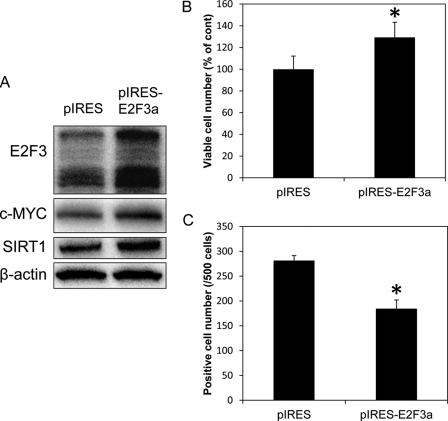
MicroRNAs regulate gene expression by repressing translation or directing sequence-specific degradation of their complementary mRNA. We recently reported that miR-203 is down-regulated, and its exogenous expression inhibits cell growth in canine oral malignant melanoma tissue specimens as well as in canine and human malignant melanoma cells. A microRNA target database predicted E2F3 and ZBP-89 as putative targets of microRNA-203 (miR-203). The expression levels of E2F3a, E2F3b, and ZBP-89 were markedly up-regulated in human malignant melanoma Mewo cells compared with those in human epidermal melanocytes. miR-203 significantly suppressed the luciferase activity of reporter plasmids containing the 3'-UTR sequence of either E2F3 or ZBP-89 complementary to miR-203. The ectopic expression of miR-203 in melanoma cells reduced the levels of E2F3a, E2F3b, and ZBP-89 protein expression. At the same time, miR-203 induced cell cycle arrest and senescence phenotypes, such as elevated expression of hypophosphorylated retinoblastoma and other markers for senescence. Silencing of E2F3, but not of ZBP-89, inhibited cell growth and induced cell cycle arrest and senescence. These results demonstrate a novel role for miR-203 as a tumor suppressor acting by inducing senescence in melanoma cells.


Figures

FIGURE 1.
FIGURE 1.
A, photographs illustrating the effect of the ectopic expression of miR-203. Cells were evaluated for SA-β-Gal activity at 120 h (Mewo) or at 96 h (A2058) after the transfection with miR-203 at 20 nm (magnification, ×200). B, SIRT1 expression levels following the ectopic expression of miR-203 at the concentration of 20 nm. Total protein from the cells was obtained at 120 h (Mewo) or at 96 h (A2058) after the transfection. Error bars, S.D.
FIGURE 2.
FIGURE 2.
A, comparison of E2F3a, E2F3b, and ZBP-89 expression levels between HEM and Mewo cells or A2058 cells. B, effects on cell viability and the expression levels of E2F3 and ZBP-89 by miR-203 introduced at a concentration of 5, 10, or 20 nm for Mewo cells and 20 nm for A2058 cells. Viable cell counting and protein extraction were performed at 120 h (Mewo) or at 96 h (A2058) after the transfection. C, effects of the transfection of Mewo cells with miR-203 at 5, 10, or 20 nm on the expression levels of E2F3 (top graph) and ZBP-89 (bottom graph) mRNAs in the cells, as assessed by using real-time PCR at 120 h post transfection. The expression levels of mRNAs were calculated by the ΔΔCt method and normalized to the level of GAPDH mRNA. *, p < 0.01. A p value was determined for the difference between the cells transfected with nonspecific control miRNA (HSS) and those transfected with various concentrations of miR-203. Error bars, S.D.
FIGURE 3.
FIGURE 3.
Analysis of the target regions for miR-203 in E2F3 and ZBP-89 mRNAs. A, homology in the 3′-UTR of human E2F3 mRNA and mature miR-203. The region including miR-203 binding sites (red box) in E2F3a and E2F3b mRNAs completely matched (middle panel). B, regions of the 3′-UTR of human ZBP-89 mRNA complementary to mature miR-203. The red boxes indicate the predicted binding sites for miR-203. The bar graph shows luciferase activities after co-transfection with control or miR-203 and each of the sensor vectors having the indicated 3′-UTR of ZBP-89. *, p < 0.05; **, p < 0.01. A p value was determined for the difference in luciferase activity between the cells transfected with nonspecific control siRNA (Dharmacon) and those transfected with miR-203. Error bars, S.D.
FIGURE 4.
FIGURE 4.
A, bar graph shows the effects of transfection of Mewo cells with siR-E2F3 at a concentration of 1, 5, or 10 nm on cell growth. The bottom panels show the expression levels of E2F3 and the target genes of E2F3 after E2F3 silencing. *, p < 0.05. A p value was determined for the difference between the cells transfected with nonspecific control miRNA (HSS) and those transfected with siRNA at the indicated concentration. B, bar graph shows the effects of transfection of Mewo cells with siR-ZBP-89 at a concentration of 1, 5, or 10 nm on cell growth. The bottom panels show the expression levels of ZBP-89 and SIRT1, a marker of senescence. In A and B, viable cell counting and protein extraction were performed at 96 h after the transfection. C, photographs illustrating the effect of the ectopic expression of 10 nm siRNAs. Cells were evaluated for SA-β-Gal activity (magnification, ×200). Error bars, S.D.
FIGURE 5.
FIGURE 5.
A, flow cytometric detection of G0/G1 and G2/M ratios of Mewo cells transfected with nonspecific control miRNA (HSS), miR-203, siR-E2F3, or siR-ZBP-89 at a concentration of 20 nm. The assay was performed at 96 h after the transfection. M1 and M2 on the histograms show the spike of G0/G1 and G2/M, respectively. The green line in the histograms indicates the control. The values in the lower table are shown as percentages of gated events. B, cell growth curve of Mewo cells transfected with nonspecific control miRNA (HSS) or miR-203 (20 nm). The number of viable cells was counted every 24 h. The transfection was done at 0 h. *, p < 0.01. The p value was determined for the difference between the cells transfected with nonspecific control miRNA and those transfected with miR-203. C, protein expression levels of E2F3 and its target genes (SIRT1 and c-MYC), senescence-associated genes (hyperphosphorylated Rb (p-Rb) and total Rb (tRb)), and cell proliferation associated genes (phosphorylated p38 (p-p38), p38, phospho-ERK1/2 (p-ERK1/2), and ERK1/2) in Mewo cells transfected with miR-203 (20 nm). Protein extraction was performed every 12 h after the transfection. Error bars, S.D.
FIGURE 6.
FIGURE 6.
A, expression levels of E2F3, c-MYC, and SIRT1 after introducing pIRES-E2F3a vector or pIRES1 neo control vector into Mewo cells. B, number of viable cells among miR-203-transfected Mewo cells incubated with pIRES1 neo control vector or pIRES-E2F3a vector. C, number of cells positive for SA-β-Gal staining after the introduction of pIRES1 neo control or pIRES-E2F3a vector into Mewo cells. pIRES indicates pIRES1 neo control vector. *, p < 0.05. The p value was determined for the difference between the cells transfected with the pIRES1 neo control vector and those transfected with the pIRES-E2F3a vector. Error bars, S.D.

References

    1. Miller A. J., Mihm M. C., Jr. (2006) Melanoma. N. Engl. J. Med. 355, 51–65 - PubMed
    1. Pacheco I., Buzea C., Tron V. (2011) Towards new therapeutic approaches for malignant melanoma. Expert Rev. Mol. Med. 13, e33. - PubMed
    1. Russo A. E., Torrisi E., Bevelacqua Y., Perrotta R., Libra M., McCubrey J. A., Spandidos D. A., Stivala F., Malaponte G. (2009) Melanoma. Molecular pathogenesis and emerging target therapies (Review). Int. J. Oncol. 34, 1481–1489 - PubMed
    1. Eggermont A. M., Robert C. (2011) New drugs in melanoma: it's a whole new world. Eur. J. Cancer 104, 397–404 - PubMed
    1. Sun B. S., Dong Q. Z., Ye Q. H., Sun H. J., Jia H. L., Zhu X. Q., Liu D. Y., Chen J., Xue Q., Zhou H. J., Ren N., Qin L. X. (2008) Lentiviral-mediated miRNA against osteopontin suppresses tumor growth and metastasis of human hepatocellular carcinoma. Hepatology. 48, 1834–1842 - PubMed

MeSH terms

LinkOut - more resources