. 2012 Apr;32(8):1468-82.
doi: 10.1128/MCB.06536-11. Epub 2012 Feb 21.

Genome-wide determination of a broad ESRP-regulated posttranscriptional network by high-throughput sequencing

Affiliations

Genome-wide determination of a broad ESRP-regulated posttranscriptional network by high-throughput sequencing

Kimberly A Dittmar et al. Mol Cell Biol. 2012 Apr.

Abstract

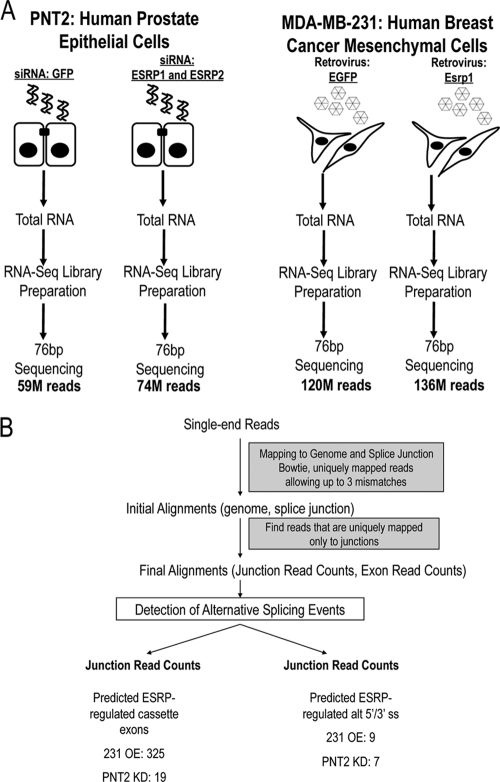
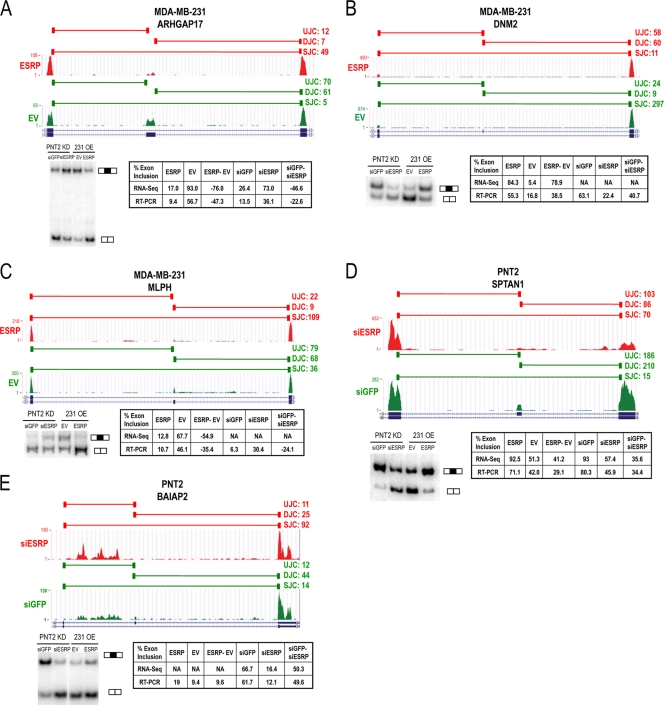
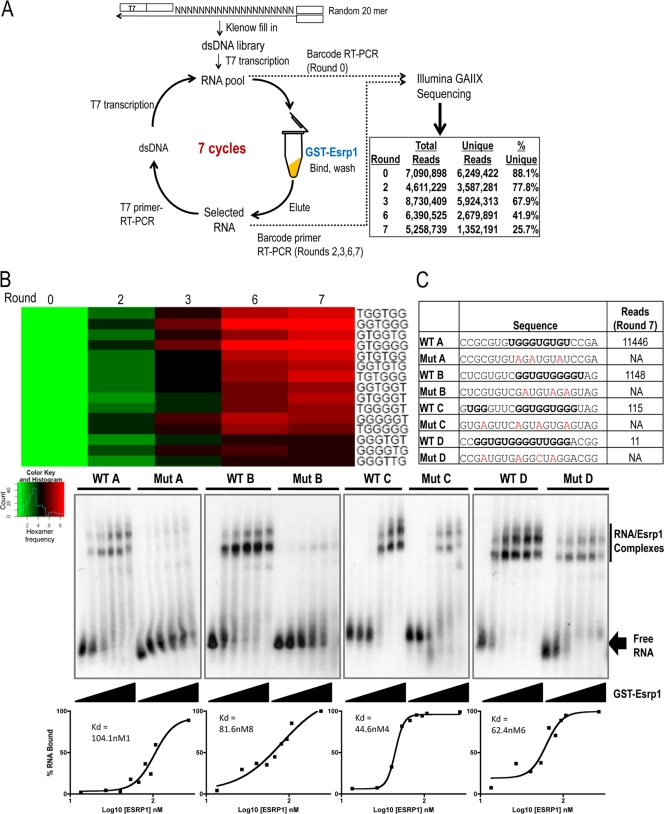
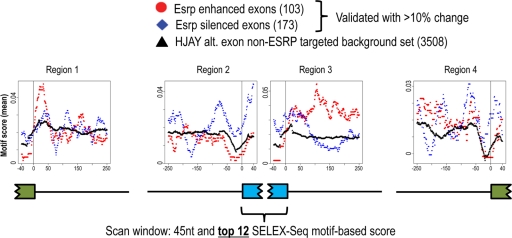
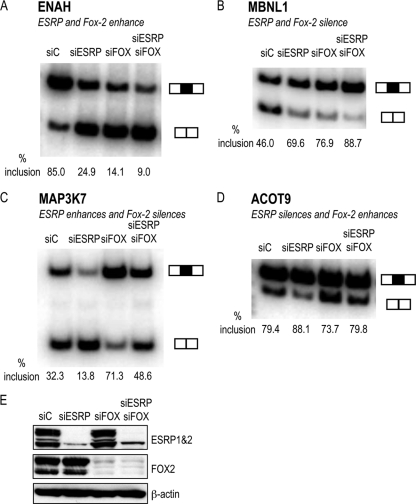
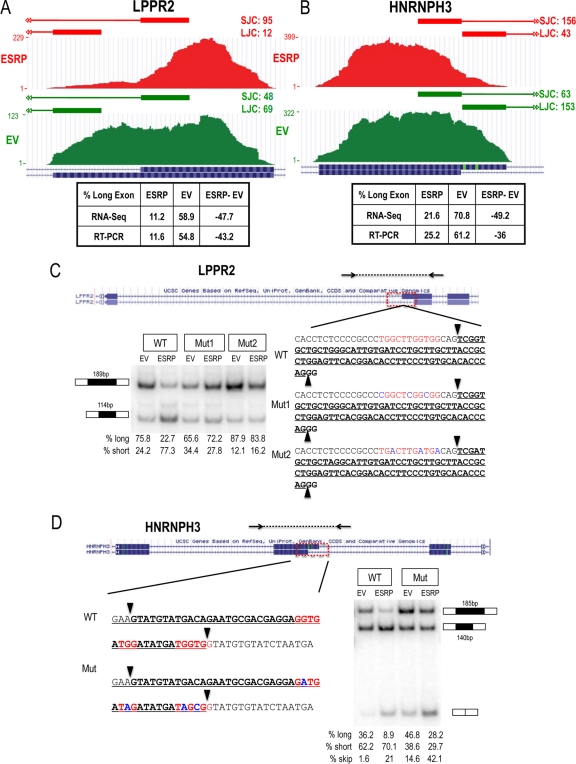
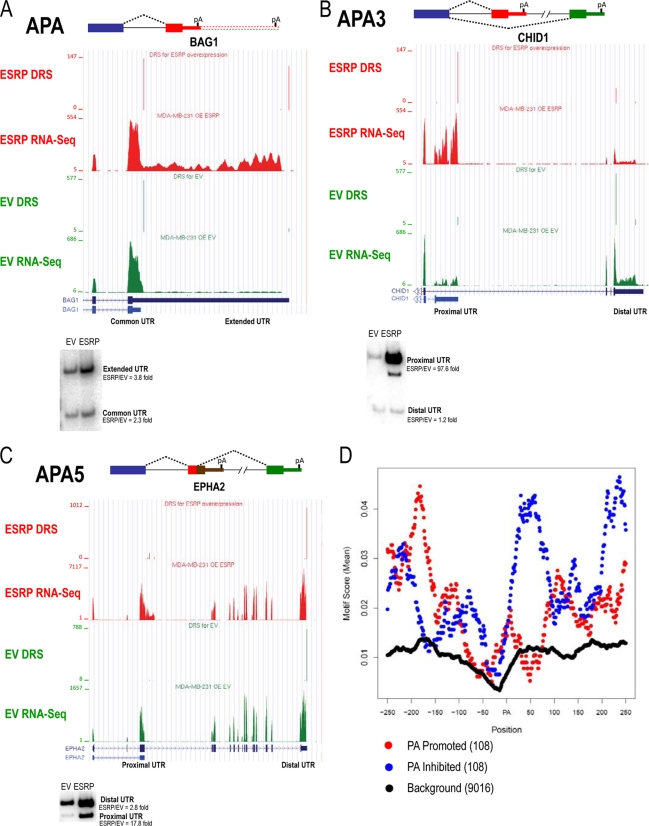
Tissue-specific alternative splicing is achieved through the coordinated assembly of RNA binding proteins at specific sites to enhance or silence splicing at nearby splice sites. We used high-throughput sequencing (RNA-Seq) to investigate the complete spectrum of alternative splicing events that are regulated by the epithelium-specific splicing regulatory proteins ESRP1 and ESRP2. We also combined this analysis with direct RNA sequencing (DRS) to reveal ESRP-mediated regulation of alternative polyadenylation. To define binding motifs that mediate direct regulation of splicing and polyadenylation by ESRP, SELEX-Seq analysis was performed, coupling traditional SELEX with high-throughput sequencing. Identification and scoring of high-affinity ESRP1 binding motifs within ESRP target genes allowed the generation of RNA maps that define the position-dependent activity of the ESRPs in regulating cassette exons and alternative 3' ends. These extensive analyses provide a comprehensive picture of the functions of the ESRPs in an epithelial posttranscriptional gene expression program.


Figures

Fig 1
Fig 1
RNA-Seq analysis detects ESRP-regulated alternative splicing events. (A) Outline of the experimental systems and RNA-Seq protocol used to identify ESRP-regulated exons. (B) Flowchart summarizing the bioinformatics analytical pipeline applied to detect ESRP-regulated alternative splicing events.
Fig 2
Fig 2
Examples of validated ESRP-regulated enhancement or silencing of RNA-Seq predicted target cassette exons. The University of California, Santa Cruz (UCSC), genome browser view of the transcripts that contain or skip the exon is shown with tracks representing the junction reads (horizontal bars on top) and exon body read counts (vertical bars below) in either MDA-MB-231 cells with ESRP overexpression (A to C) or PNT2 cells with ESRP knockdown (D and E). The green tracks represent control cells and the red tracks represent ESRP knockdown or overexpression. The upstream junction read count (UJC), downstream junction read count (DJC), and skipping junction read count (SJC) are on the right in each panel, and at the bottom are RT-PCR validation gels with bands corresponding to exon inclusion and skipping indicated. Tables present the exon inclusion levels from RNA-Seq and RT-PCR. For the percent change in exon inclusion (ESRP-EV or siGFP-siESRP), negative values indicate ESRP-silenced exons and positive values indicate ESRP-enhanced exons. (A) ESRP-silenced exon in ARHGAP17; (B) ESRP-enhanced exon in DNM2; (C) ESRP-silenced exon in MLPH; (D) ESRP-enhanced exon in SPTAN1; (E) ESRP-enhanced exon in BAIAP2.
Fig 3
Fig 3
SELEX-Seq defines a UG-rich ESRP binding motif (A) Schematic for SELEX-Seq protocol. The total and unique number of reads obtained by Illumina sequencing in each sequencing round are shown. (B) SELEX-Seq-identified 6-mer motifs after seven rounds of selection and their enrichment in each round. (C) EMSA analysis of ESRP1 binding affinity to selected 20-mer sequences using increasing amounts of GST-Esrp1 (0 to 250 ng), shown from left to right. Dissociation constants (Kds) were calculated from EMSAs using additional protein concentrations. Potential ESRP binding sites within the wild-type 20-mer sequences are in bold, and mutations that are expected to abolish ESRP binding are in red. The number of reads obtained for each selected sequence from round 7 is also shown.
Fig 4
Fig 4
A functional map for ESRP position-dependent regulation of alternative splicing. The top 12 6-mer ESRP binding motifs from SELEX-Seq were used to derive an ESRP binding score, which is mapped across the set of 276 validated ESRP-regulated cassette exons with at least 10% change and the 250-nt intronic sequences flanking these exons, with enhanced exons in red and silenced exons in blue. This was also mapped across a set of alternative exons present on the HJAY arrays but not ESRP regulated (black). Each position in the RNA map represents the ESRP score within a 45-nt window, centered at the current position and averaged over all exons in a given group.
Fig 5
Fig 5
The ESRPs and FOX2 combinatorially regulate the alternative splicing of common cassette exons. RT-PCR analysis of ESRP and FOX2 coregulated exons was performed in PNT2 cells with knockdown of ESRP1 and ESRP2 (siESRP), FOX2 (siFOX), and ESRP1 and ESRP2 and FOX2 combined (siESRP siFOX) and in control cells (siC). Data are shown for alternative exons in ENAH, which is enhanced by ESRP and FOX2 (A), MBNL1, which is silenced by ESRP and FOX2 (B), MAP3K7, which is enhanced by ESRP and silenced by FOX2 (C), and ACOT9, which is silenced by ESRP and enhanced by FOX2 (D). (E) A Western blot demonstrates the knockdown of ESRP and FOX2.
Fig 6
Fig 6
The ESRPs regulate alternative 3′ and 5′ splice sites. The UCSC browser view of the alternative 3′ splice sites of LPPR2 exon 4 (A) and alternative 5′ splice sites of HNRNPH3 exon 4 (B) are shown with tracks representing the junction reads (horizontal bars on top) and exon body read counts (vertical bars below) in MDA-MB-231 control cells (EV, green) or ESRP-overexpressing cells (ESRP, red). Tables present the predicted levels of the long exon from RNA-Seq and the experimentally determined levels from RT-PCR. Minigene splicing reporters were constructed containing LPPR2 exon 4 (bold) (C) or HNRNPH3 exon 4 (bold) (D) and conserved flanking intronic sequences. The long form of each exon is underlined, and alternative splice sites are indicated by arrowheads. Conserved intronic and exonic UGG-rich elements near the alternative splice sites are in red, and point mutations within UGG motifs are in blue. RT-PCR analysis for the minigenes is shown.
Fig 7
Fig 7
The ESRPs regulate alternative 3′-end formation. Examples of three types of alternative 3′-end formation regulated by the ESRPs are shown with UCSC browser views of RNA-Seq and direct RNA sequencing (DRS) read counts from MDA-MB-231 control (EV, green) versus ESRP-overexpressing cells (ESRP, red) and RT-PCR validations. (A) Alternative polyadenylation within the same 3′ UTR (APA); (B) alternative polyadenylation associated with alternative 3′ splice site usage (APA3); (C) alternative polyadenylation associated with alternative 5′ splice site usage (APA5). (D) A functional map for ESRP position-dependent regulation of alternative polyadenylation. The top 12 6-mer ESRP binding motifs from SELEX-Seq were used to derive an ESRP binding score, which is shown mapped across the set of 108 DRS-identified and RNA-Seq cross-validated ESRP-regulated poly(A) sites and the 250 nt upstream and downstream with promoted sites in red and silenced sites in blue. These motifs were also mapped across a background set of annotated poly(A) sites (black).
Fig 8
Fig 8
The subnetwork of functional interactions of ESRP-target networks. Circles represent genes of ESRP targets, while diamonds represent linker genes. FIs extracted from pathways are shown as solid lines, while predicted FIs based on the naïve Bayes classifier are shown as dashed lines. FIs involved in activation, expression regulation, or catalysis are shown with an arrowhead, while T bars indicate inhibition. (A) Detailed view of module 1, enriched for pathways related to cell-cell adhesion, including those for E-cadherin-based adherens junctions, tight junctions, and nectin-based adhesion components. (B) Detailed view of module 2, enriched for the Rho GTPase signaling pathway.

References

    1. Barash Y, et al. 2010. Deciphering the splicing code. Nature 465: 53–59 - PubMed
    1. Blick T, et al. 2008. Epithelial mesenchymal transition traits in human breast cancer cell lines. Clin. Exp. Metastasis 25: 629–642 - PubMed
    1. Brooks AN, et al. 2011. Conservation of an RNA regulatory map between Drosophila and mammals. Genome Res. 21: 193–202 - PMC - PubMed
    1. Brown RL, et al. 2011. CD44 splice isoform switching in human and mouse epithelium is essential for epithelial-mesenchymal transition and breast cancer progression. J. Clin. Invest. 121: 1064–1074 - PMC - PubMed
    1. Castelo-Branco P, et al. 2004. Polypyrimidine tract binding protein modulates efficiency of polyadenylation. Mol. Cell. Biol. 24: 4174–4183 - PMC - PubMed

Publication types

LinkOut - more resources