

The development of hypertension and hyperaldosteronism in a rodent model of life-long obesity
- PMID: 22355066
- PMCID: PMC3320259
- DOI: 10.1210/en.2011-1176
The development of hypertension and hyperaldosteronism in a rodent model of life-long obesity
Abstract
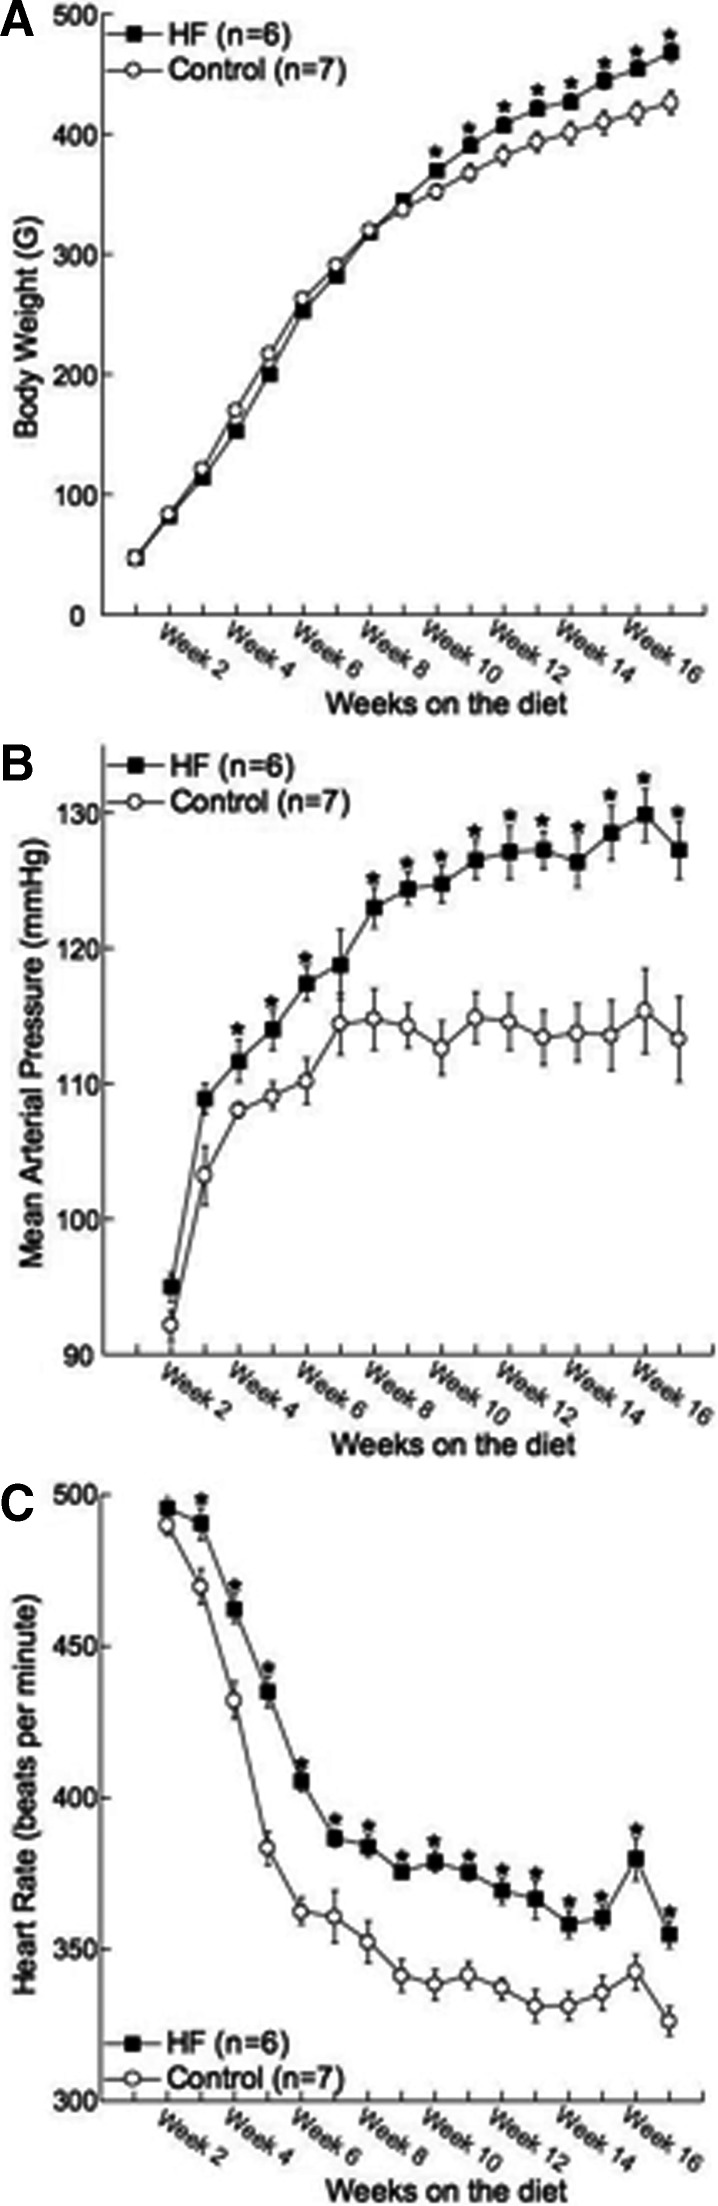
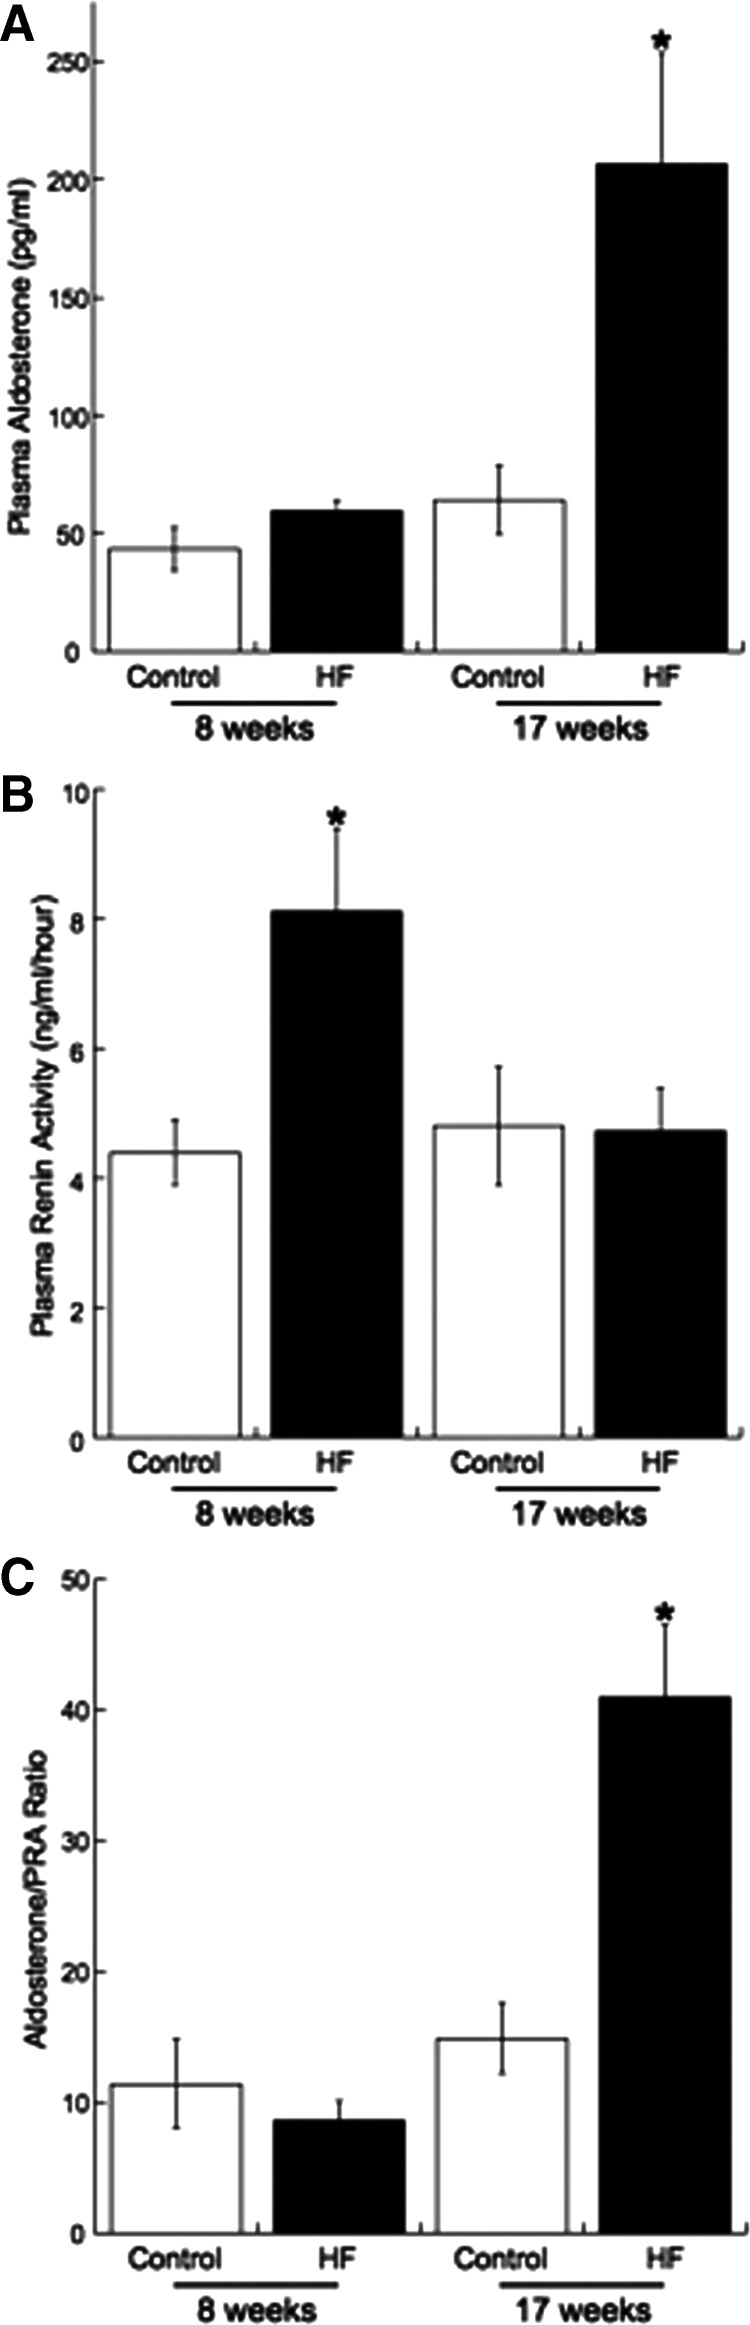
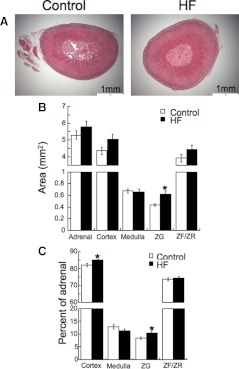
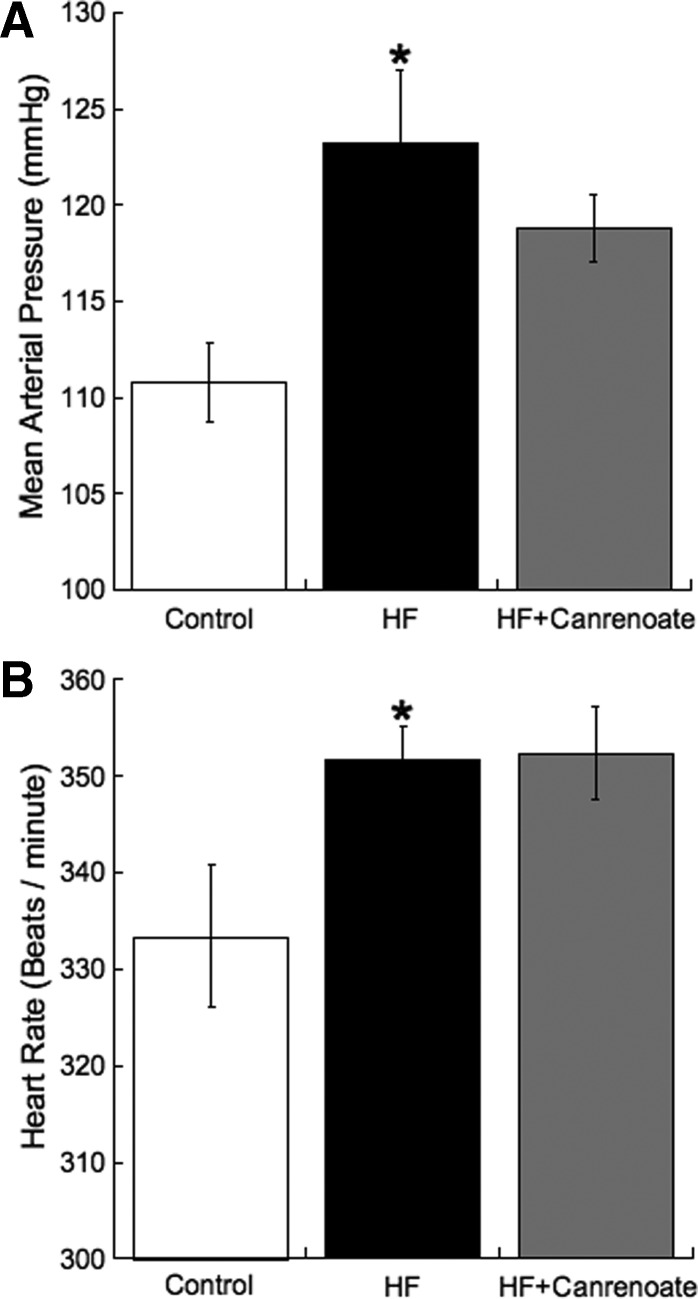
Aldosterone has been linked to the deleterious cardiovascular effects of obesity in humans. The association of aldosterone with obesity in rodents is less well defined, particularly in models of diet-induced obesity. We hypothesized that adrenal aldosterone production and aldosterone synthase expression would be increased in rats with obesity-induced hypertension. Male Sprague Dawley rats were fed a high-fat (HF: 36% fat) or control diet from 3 wk of age, and mean arterial pressure (MAP) was measured by telemetry. MAP was increased after 4 wk of HF diet; this was 6 wk before changes in body weight. Mineralocorticoid receptor antagonism did not prevent the HF-induced increase in MAP. After 17 wk on the diets, HF rats had increased body and fat weights (abdominal and epididymal) and were insulin resistant (Homeostasis Model Assessment index: 3.53 ± 0.43 vs. 8.52 ± 1.77; control vs. HF, P < 0.05). Plasma aldosterone levels were increased in the HF rats (64.14 ± 14.96 vs. 206.25 ± 47.55 pg/ml; control vs. HF, P < 0.05). This occurred independently of plasma renin activity (4.8 ± 0.92 vs. 4.73 ± 0.66 ng/ml/h, control vs. HF). The increase in aldosterone was accompanied by a 2-fold increase in adrenal aldosterone synthase mRNA expression and zona glomerulosa hypertrophy. Rats were also studied after 8 wk of HF diet, a time when MAP, but not body weight, was increased. At this time plasma aldosterone was unchanged but plasma renin activity was increased (4.4 ± 0.5 vs. 8.1 ± 1.3 ng/ml/h; control vs. HF, P < 0.05). These studies suggest that rats fed a HF diet from weaning may be a useful model for studying obesity-associated hyperaldosteronism.
Figures
Similar articles
-
Obesity-induced hypertension develops in young rats independently of the renin-angiotensin-aldosterone system.Exp Biol Med (Maywood). 2006 Mar;231(3):282-7. doi: 10.1177/153537020623100307. Exp Biol Med (Maywood). 2006. PMID: 16514174
-
Meriones unguiculatus serves as a spontaneous primary aldosteronism rodent model.PLoS One. 2025 Feb 13;20(2):e0314943. doi: 10.1371/journal.pone.0314943. eCollection 2025. PLoS One. 2025. PMID: 39946402 Free PMC article.
-
Role of dietary potassium in the hyperaldosteronism and hypertension of the remnant kidney model.J Am Soc Nephrol. 2000 Apr;11(4):625-631. doi: 10.1681/ASN.V114625. J Am Soc Nephrol. 2000. PMID: 10752521
-
The Role of Aldosterone in Obesity-Related Hypertension.Am J Hypertens. 2016 Apr;29(4):415-23. doi: 10.1093/ajh/hpw003. Epub 2016 Feb 28. Am J Hypertens. 2016. PMID: 26927805 Free PMC article. Review.
-
The neurohormonal natural history of essential hypertension: towards primary or tertiary aldosteronism?J Hypertens. 2002 Jan;20(1):11-5. doi: 10.1097/00004872-200201000-00003. J Hypertens. 2002. PMID: 11791020 Review.
Cited by
-
Mineralocorticoid receptor antagonism prevents obesity-induced cerebral artery remodeling and reduces white matter injury in rats.Microcirculation. 2018 Jul;25(5):e12460. doi: 10.1111/micc.12460. Epub 2018 Jun 7. Microcirculation. 2018. PMID: 29758591 Free PMC article.
-
The effects of obesity on the cerebral vasculature.Curr Vasc Pharmacol. 2014 May;12(3):462-72. doi: 10.2174/1570161112666140423222411. Curr Vasc Pharmacol. 2014. PMID: 24846235 Free PMC article. Review.
-
Positive Association Between Plasma Aldosterone Concentration and White Matter Lesions in Patients With Hypertension.Front Endocrinol (Lausanne). 2021 Nov 18;12:753074. doi: 10.3389/fendo.2021.753074. eCollection 2021. Front Endocrinol (Lausanne). 2021. PMID: 34867798 Free PMC article.
-
Superoxide Anions and NO in the Paraventricular Nucleus Modulate the Cardiac Sympathetic Afferent Reflex in Obese Rats.Int J Mol Sci. 2017 Dec 27;19(1):59. doi: 10.3390/ijms19010059. Int J Mol Sci. 2017. PMID: 29280941 Free PMC article.
-
Prenatal dexamethasone and postnatal high-fat diet have a synergistic effect of elevating blood pressure through a distinct programming mechanism of systemic and adipose renin-angiotensin systems.Lipids Health Dis. 2018 Mar 14;17(1):50. doi: 10.1186/s12944-018-0701-0. Lipids Health Dis. 2018. PMID: 29540174 Free PMC article.
References
-
- Hall JE. 2003. The kidney, hypertension, and obesity. Hypertension 41:625–633 - PubMed
-
- Sironi AM, Gastaldelli A, Mari A, Ciociaro D, Positano V, Postano V, Buzzigoli E, Ghione S, Turchi S, Lombardi M, Ferrannini E. 2004. Visceral fat in hypertension: influence on insulin resistance and β-cell function. Hypertension 44:127–133 - PubMed
-
- Malik S, Wong ND, Franklin SS, Kamath TV, L'Italien GJ, Pio JR, Williams GR. 2004. Impact of the metabolic syndrome on mortality from coronary heart disease, cardiovascular disease, and all causes in United States adults. Circulation 110:1245–1250 - PubMed
-
- Reaven GM. 1988. Banting lecture 1988. Role of insulin resistance in human disease. Diabetes 37:1595–1607 - PubMed
-
- Nagase M, Fujita T. 2009. Mineralocorticoid receptor activation in obesity hypertension. Hypertens Res 32:649–657 - PubMed
Publication types
MeSH terms
Substances
Grants and funding
LinkOut - more resources
Full Text Sources
Medical
Research Materials
Miscellaneous
