. 2012 Apr;153(4):1999-2011.
doi: 10.1210/en.2011-1833. Epub 2012 Feb 21.

RNA-seq analysis of the functional compartments within the rat placentation site

Affiliations

RNA-seq analysis of the functional compartments within the rat placentation site

Kartik Shankar et al. Endocrinology. 2012 Apr.

Abstract

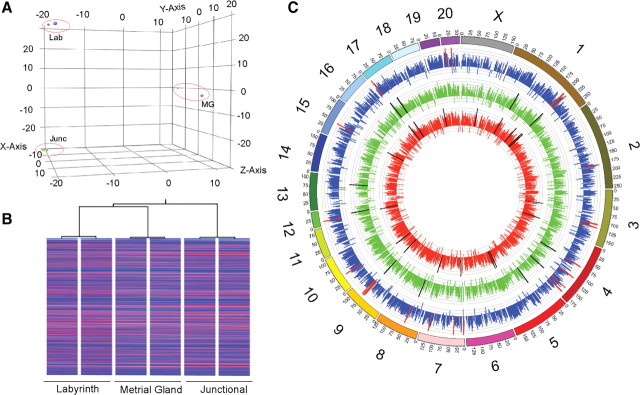
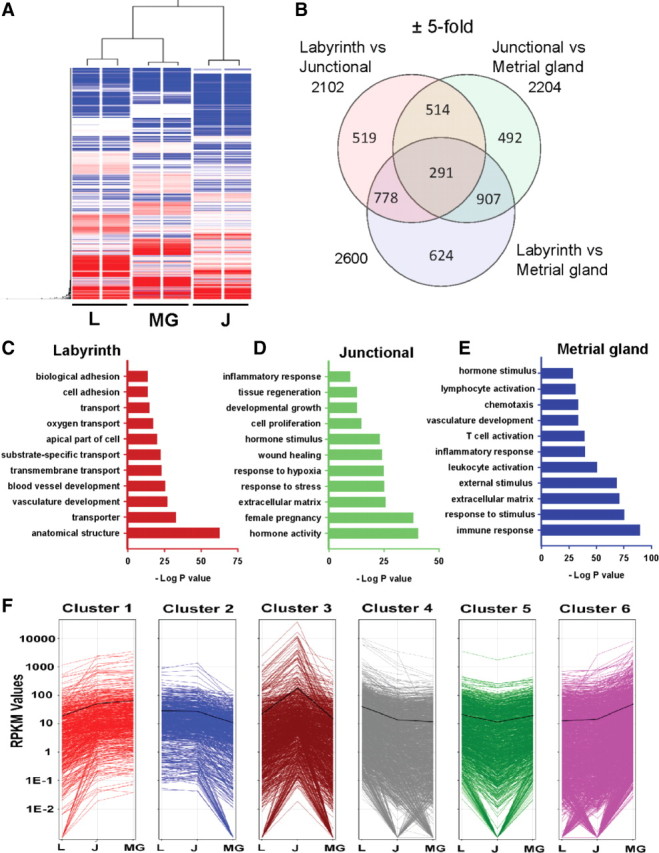
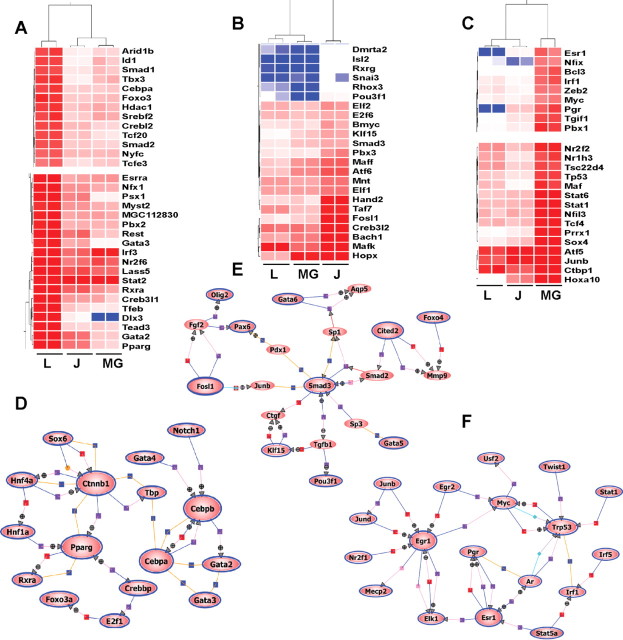
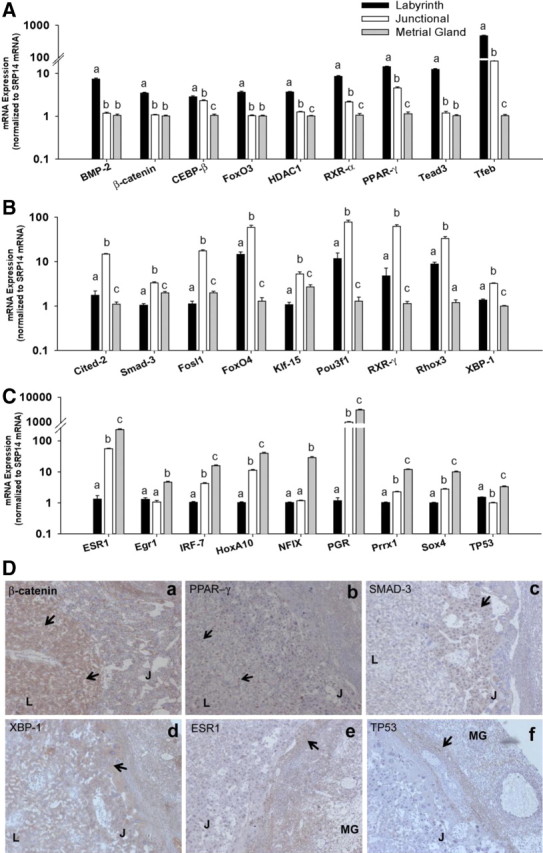
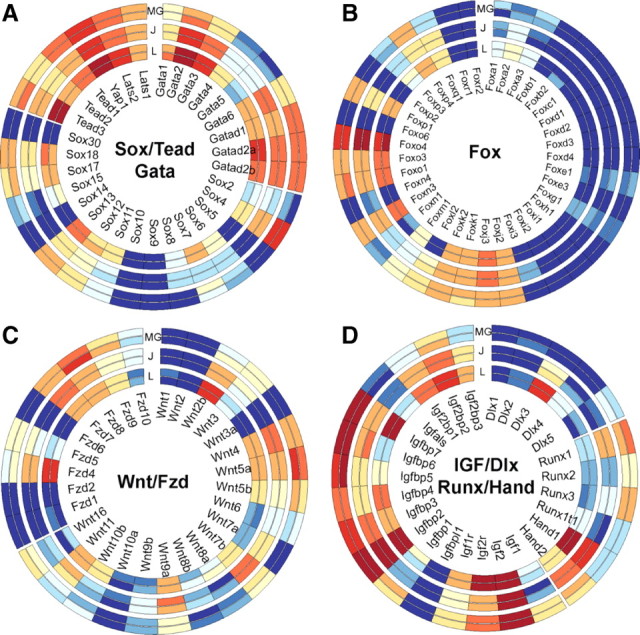
The rat placentation site is distinctly organized into interacting zones, the so-called labyrinth, junctional, and metrial gland compartments. These zones house unique cell populations equipped to undertake myriad prescribed functions including transport, hormonal responses, and immune interactions. Although much is known about the genesis of these cell types and specific markers that characterize each zone, a detailed global overview of gene expression in the three zones is absent. In this report, we used massively parallel sequencing (RNA-seq) to assess mRNA expression profiles and generated transcriptomic maps for each zone of the late-gestation rat placentation site (18.5 d postcoitum). Analysis of expression profiles revealed that each compartment expressed a unique signature, characterized by biological processes specific to the zone. Transport and vasculature-related processes predominated in the labyrinth, hormone secretion in the junctional, and immune interactions in the metrial gland. Furthermore, our analysis identified approximately 4000 differentially expressed genes within the zones. Using k-means clustering, we identified transcription factors with highest expression in either labyrinth, junctional, or metrial gland. Direct interaction (pathway) analysis revealed unique transcription factor networks operating in each compartment. The site-specific expression of 27 transcription factors in the three zones was ascertained via quantitative PCR and protein expression of six transcription factors was confirmed by immunohistochemistry. Finally, we elucidated the expression of key developmentally important families (Sox, GATA, Fox, Wnt, Tead, and IGF/IGFBP) in the placentation site to reveal novel expression of these several factors. The present dataset provides a novel resource to understand zonal gene expression and function in the placenta.


Figures

Fig. 1.
Fig. 1.
Overall gene expression patterns of utero-placental functional compartments. RPKM values for all Refseq genes in rat labyrinth zone, junctional zone, and metrial gland. A and B, Principal component analysis (A) and hierarchical clustering on conditions of global gene expression profiles from rat labyrinth zone, junctional zone, and metrial gland (B). Expression profiles of individual samples belonging to the same compartment are highly related and cluster together. C, Genome-wide visualization of mRNA abundance in utero-placental compartments using Circos. RPKM values are plotted over the whole rat genome. The outer ring represents chromosomes oriented pter-qter in a clockwise direction. Outside numbers indicate chromosome number. RPKM data are represented for the labyrinth zone in red (innermost track), junctional zone in green (center track), and metrial gland in blue (outer track). The inner scale for each track (in gray) is log transformed. Bars in black (for labyrinth and junctional zones) and red (for metrial gland) represent the genomic localizations of the top 25 most abundant transcripts in each respective compartment. A complete list is included in Supplemental Materials.
Fig. 2.
Fig. 2.
Identification of gene signatures within utero-placental functional compartment. A, Hierarchical clustering of the union of differentially altered transcripts between labyrinth zone, junctional zone, and metrial gland. Differentially expressed genes were generated using one-way ANOVA, followed by pair-wise comparisons and a minimum threshold of ±5-fold change within each comparison. Statistical analysis and clustering were carried out using Avadis NGS. B, Venn diagram representing overlap between differentially expressed genes in the labyrinth zone, junctional zone, and metrial gland (n = 2 biological replicates, each representing pools of seven to eight separate placenta from five separate rat dams). C–E, Functional enrichment analysis of GO biological processes in labyrinth zone (C), junctional zone (D), and metrial gland (E). The x-axis indicates −log10 corrected P values for enrichment with the indicated GO term. F, k- means clustering of union of differentially altered transcripts between labyrinth zone, junctional zone, and metrial gland. Differentially expressed genes were resolved into six clusters. The y-axis represents log10 RPKM, and L, J, and MG indicate means for labyrinth zone, junctional zone, and metrial gland.
Fig. 3.
Fig. 3.
Identification of unique transcription factors within utero-placental functional compartments. A–C, Representative subclusters of correlation-based hierarchical clustering of transcription factors highly expressed in labyrinth zone (A), junctional zone (B), and metrial gland (C). Transcription factors were queried from clusters 3, 4, and 6 for junctional zone, labyrinth zone, and metrial gland, respectively. Heat-map colors red, white, and blue represent up-regulation, no relative effect, and down-regulation of transcripts, respectively. Complete list of transcription factors and hierarchical clusters are included in Supplemental Materials. Gene symbols can be queried at http://www.ncbi.nlm.nih.gov/gene. D–F, Direct Interaction (pathway) analysis of transcription factors enriched in labyrinth zone (D), junctional zone (E), and metrial gland (F).
Fig. 4.
Fig. 4.
mRNA expression of transcription factors in labyrinth zone, junctional zone, and metrial gland. A–C, Placental expression of transcription factor mRNA at dpc 18.5 in labyrinth zone (A), junctional zone (B), and metrial gland (C) (n = 15 per group). Gene expression was assessed via real-time RT-PCR and normalized to abundance of SRP14 mRNA. Data are expressed relative to lowest group. Statistical differences were determined using one-way ANOVA followed by Tukey's HSD. Different letters indicate P < 0.05. The y-axis is set to log10 scale. D, Immunohistochemical staining for β-catenin (a), PPAR-γ (b), Smad-3 (c), XBP-1 (d), ER-α (e), and p53 (f) in placental sections. L, J, and MG indicate labyrinth, junctional, and metrial gland areas. Arrows show areas of positive staining. Magnification, ×50.
Fig. 5.
Fig. 5.
mRNA expression of select transcription factor families in the rat placentation site. Heat maps depicting expression levels of Sox, Tead, and Gata (A); Fox (B); Wnt/Fzd (C); and Igf, Dlx, Runx, and Hand (D) families of transcription factors and developmental regulators in rat labyrinth zone, junctional zone, and metrial gland. Six tracks represent log-transformed RPKM data from individual biological pools and are separated (by white space) into sets of two, of labyrinth zone (innermost), junctional zone (middle), and metrial gland (outer). Gene symbols are indicated in the middle. For RPKM data, red, white, and blue represent high, medium, and low absolute levels of abundance, respectively. Images were created using Circos.

Similar articles

Cited by

References

    1. Cross JC. 2006. Placental function in development and disease. Reprod Fertil Dev 18:71–76 - PubMed
    1. Maltepe E , Bakardjiev AI , Fisher SJ. 2010. The placenta: transcriptional, epigenetic, and physiological integration during development. J Clin Invest 120:1016–1025 - PMC - PubMed
    1. Hu D , Cross JC. 2010. Development and function of trophoblast giant cells in the rodent placenta. Int J Dev Biol 54:341–354 - PubMed
    1. Rossant J , Cross JC. 2001. Placental development: lessons from mouse mutants. Nat Rev Genet 2:538–548 - PubMed
    1. Ain R , Canham LN , Soares MJ. 2003. Gestation stage-dependent intrauterine trophoblast cell invasion in the rat and mouse: novel endocrine phenotype and regulation. Dev Biol 260:176–190 - PubMed

Publication types

MeSH terms

Substances