. 2012;4(3):382-93.
doi: 10.1093/gbe/evs017. Epub 2012 Feb 21.

Population genomics and phylogeography of an Australian dairy factory derived lytic bacteriophage

Affiliations

Population genomics and phylogeography of an Australian dairy factory derived lytic bacteriophage

Eduardo Castro-Nallar et al. Genome Biol Evol. 2012.

Abstract

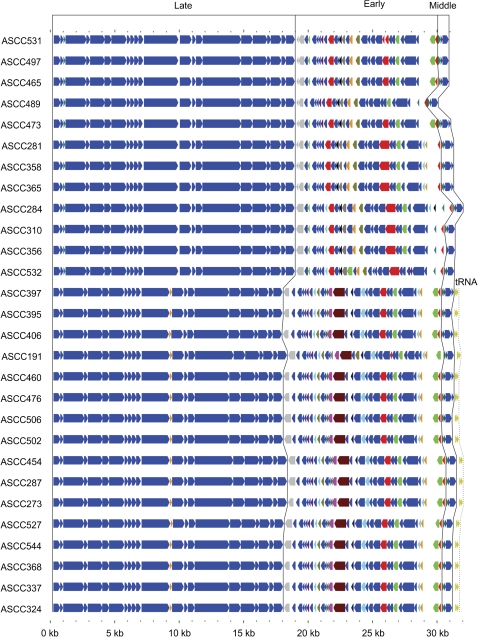
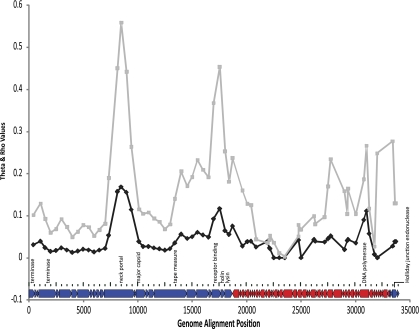
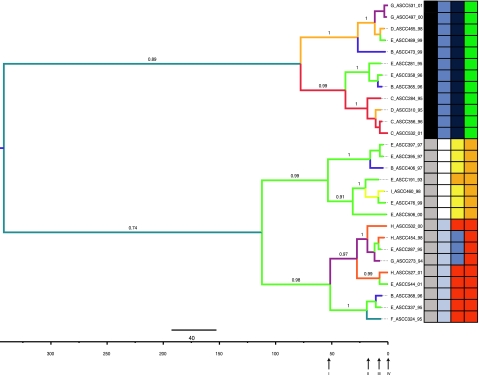
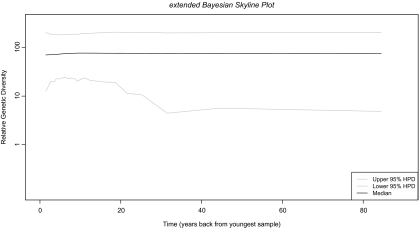
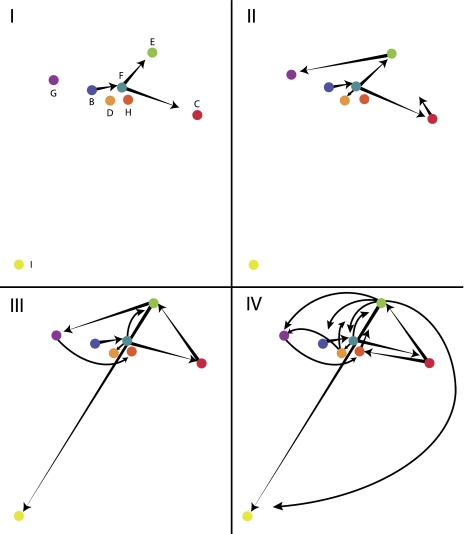
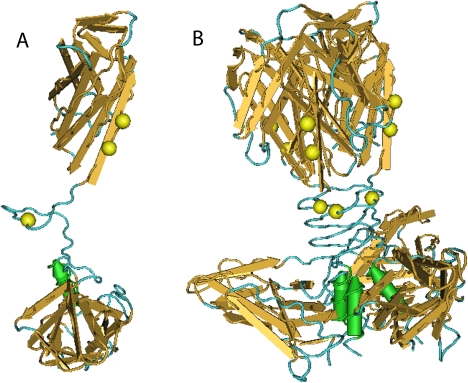
In this study, we present the full genomic sequences and evolutionary analyses of a serially sampled population of 28 Lactococcus lactis-infecting phage belonging to the 936-like group in Australia. Genome sizes were consistent with previously available genomes ranging in length from 30.9 to 32.1 Kbp and consisted of 55-65 open reading frames. We analyzed their genetic diversity and found that regions of high diversity are correlated with high recombination rate regions (P value = 0.01). Phylogenetic inference showed two major clades that correlate well with known host range. Using the extended Bayesian Skyline model, we found that population size has remained mostly constant through time. Moreover, the dispersion pattern of these genomes is in agreement with human-driven dispersion as suggested by phylogeographic analysis. In addition, selection analysis found evidence of positive selection on codon positions of the Receptor Binding Protein (RBP). Likewise, positively selected sites in the RBP were located within the neck and head region in the crystal structure, both known determinants of host range. Our study demonstrates the utility of phylogenetic methods applied to whole genome data collected from populations of phage for providing insights into applied microbiology.


Figures

F<sc>ig.</sc> 1.
Fig. 1.
Schematic genome alignment of Australian cheese factory derived 936-like phage used for this study. Phage genomes are represented as colored arrows indicative of the direction of transcription of protein and tRNA encoding genes. Those orthologs conserved in all phage are colored dark blue while those present in a subset of phage are in a variety of colors. The gray ortholog present in all genomes is an intact gene in some genomes and an apparent pseudogene in others. Black lines indicate the boundaries between those regions encoded during the early, middle, and late phases of transcriptions. The tRNA genes encoded by some phage are also indicated by olive green arrows.
F<sc>IG</sc>. 2.
FIG. 2.
Plot of recombination rate and genetic diversity for aligned phage genomes. Genetic diversity plotted as Θ per site (black line) and recombination rate ρ per kb (gray line) as a function of time as determined in dnaSP 5.0 and LDhat 2.5, respectively. A schematic representation of all the orthologs present in the concatenated alignment used for phylogenetic analysis annotated with selected genes to provide a point of reference is below the graph. Orthologs colored red are early transcripts while those in blue represent late and middle transcripts (left and right, respectively).
F<sc>IG</sc>. 3.
FIG. 3.
Maximum clade credibility phylogeny of the twenty-eight 936-like phage. Branch values represent posterior probability support. Branches are colored according to the ancestral state of geographic location. Taxa names indicate factory key_phage_year of isolation. The tree is midpoint rooted. On the grid: first column indicates host tropism, black: 222/385 and gray: 92/818/962 Lactococcus lactis host strains. Second, third, and fourth columns are codons under positive selection 155, 165, and 167, respectively. Blue: methionine; white: gap; light blue: leucine; dark blue: phenylalanine; yellow: tyrosine; orange: serine; red: threonine; green: alanine. Arrows below time line relate dispersion analysis described in figure 5.
F<sc>ig.</sc> 4.
Fig. 4.
Plot of genetic diversity over time. Extended Bayesian Skyline Plot describing population changes as a function of time. The y axis represents relative genetic diversity and x axis represents years backward in time from the most contemporaneous sample, that is, 2001. Mean and median are shown with 95% credibility intervals.
F<sc>IG</sc>. 5.
FIG. 5.
Dispersion pattern of Australian 936-like phages. Phylogeographic analysis for time-points I–IV (root to tips; linked to positions designated in fig. 3) showing the dispersion routes of the ancestral lineages that explain the current sampling geographic distribution. Letters indicate phage from eight different geographic locations, color-coded as in figure. I–IV are four “time slices” arbitrarily chosen to describe the dispersion pattern. Although no scale is provided, the overall diagram spans hundreds of kilometers.
F<sc>IG</sc>. 6.
FIG. 6.
Molecular mapping of positive selected sites detected in RBP. (A) Monomer structure with three sites mapped on it; (B) Homotrimer (active structure) with sites mapped in each chain. Molecular structure retrieved from NCBI structure database, PDB code 2BSD.

Similar articles

Cited by

References

    1. Akaike H. A new look at the statistical model identification. IEEE Trans Automat Contr. 1974;19:716–723.
    1. Bennett SN, et al. Epidemic dynamics revealed in dengue evolution. Mol Biol Evol. 2010;27:811–818. - PMC - PubMed
    1. Boucher I, Emond E, Dion E, Montpetit D, Moineau S. Microbiological and molecular impacts of Abik on the lytic cycle of Lactococcus lactis phages of the 936 and P335 species. Microbiology. 2000;146:445–453. - PubMed
    1. Brussow H, Canchaya C, Hardt W. Phages and the evolution of bacterial pathogens: from genomic rearrangements to lysogenic conversion. Microbiol Mol Biol Rev. 2004;68:560–602. - PMC - PubMed
    1. Casjens SR. Comparative genomics and evolution of the tailed-bacteriophages. Curr Opin Microbiol. 2005;8:451–458. - PubMed

Publication types

Associated data