. 2012;4(4):466-85.
doi: 10.1093/gbe/evs018. Epub 2012 Feb 21.

An evolutionary network of genes present in the eukaryote common ancestor polls genomes on eukaryotic and mitochondrial origin

Affiliations

An evolutionary network of genes present in the eukaryote common ancestor polls genomes on eukaryotic and mitochondrial origin

Thorsten Thiergart et al. Genome Biol Evol. 2012.

Abstract

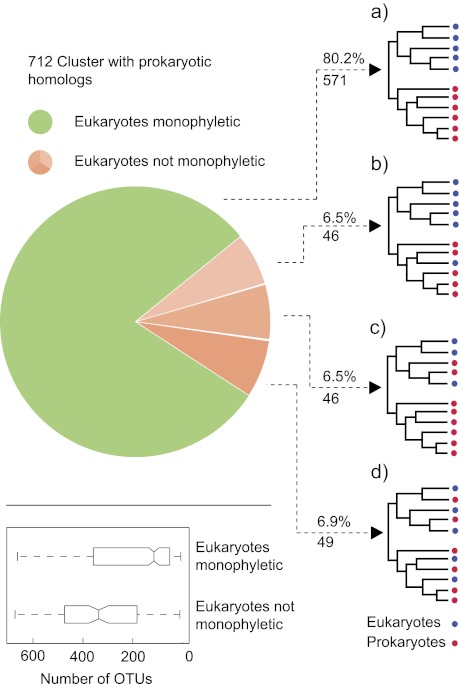
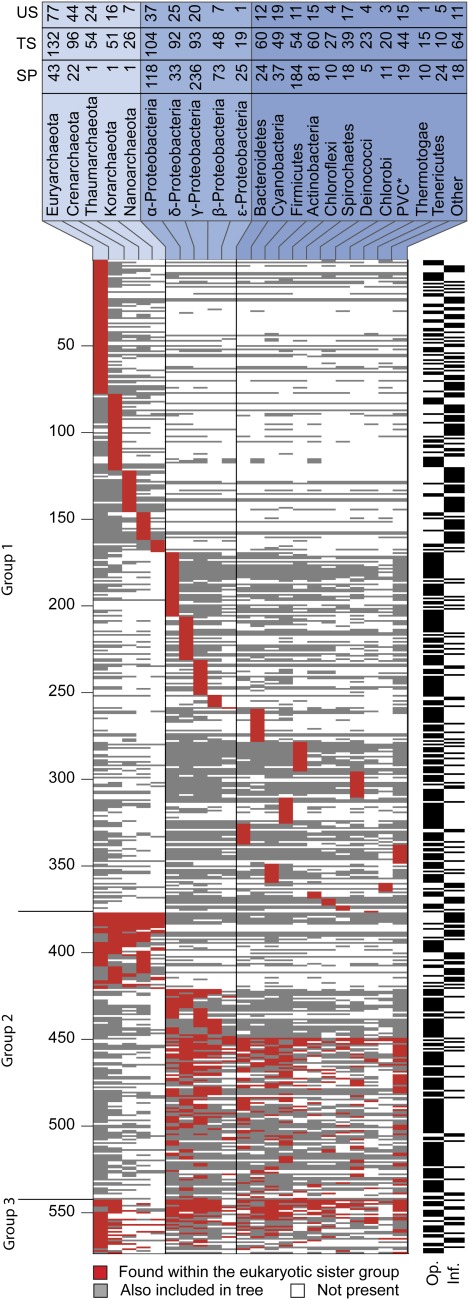
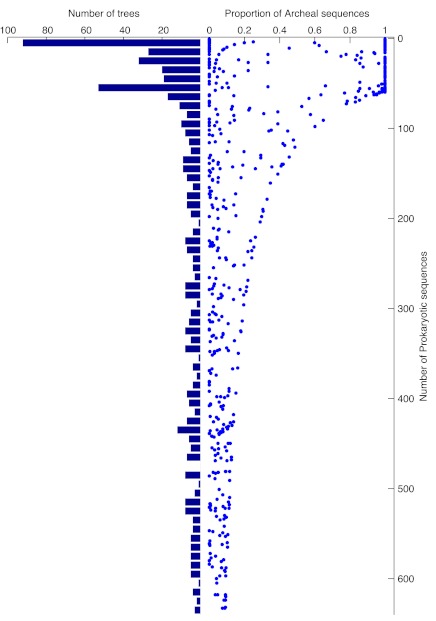
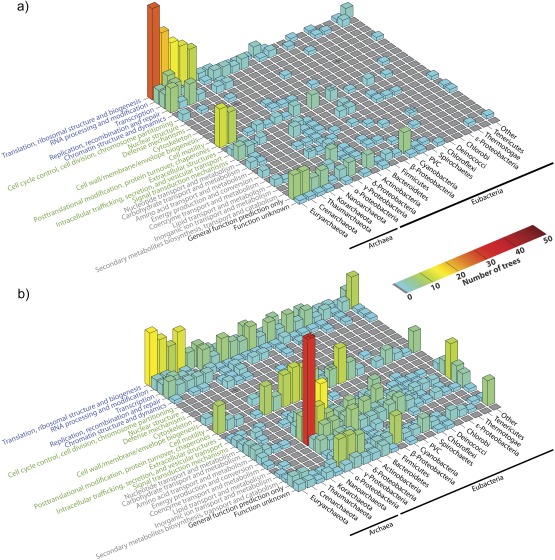
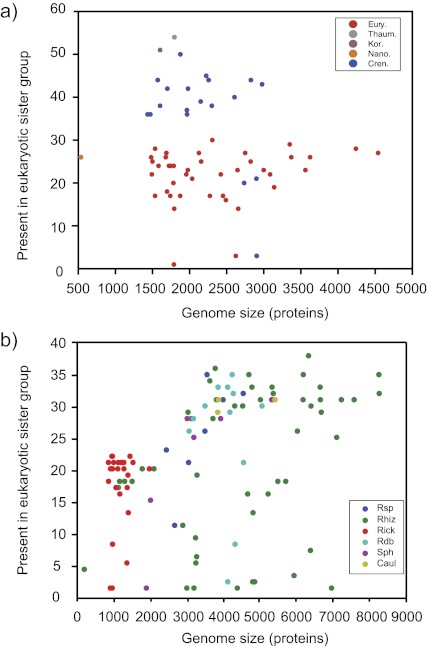
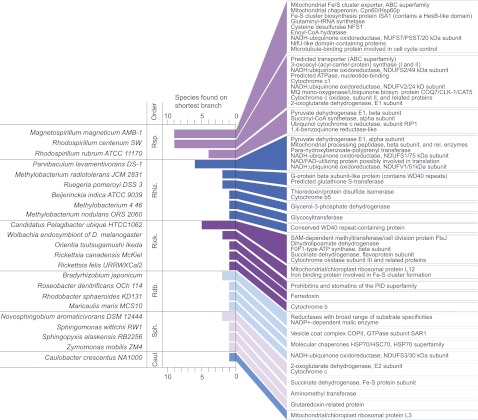
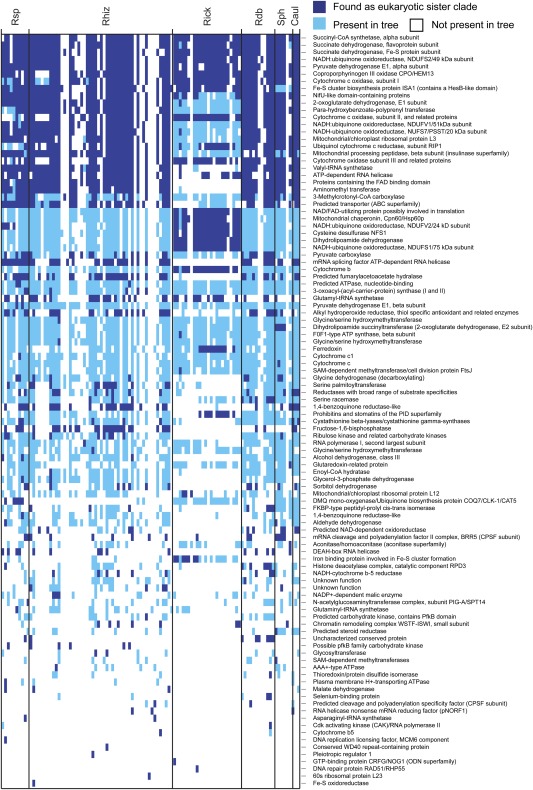
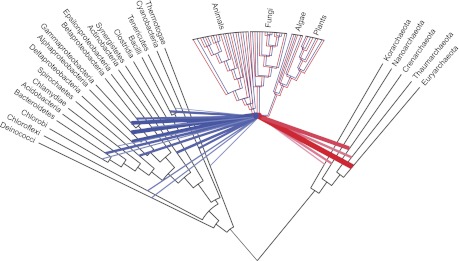
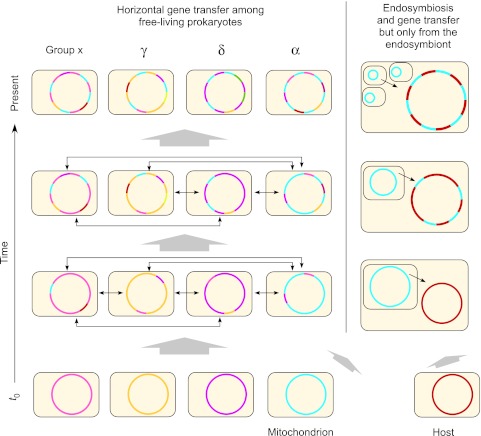
To test the predictions of competing and mutually exclusive hypotheses for the origin of eukaryotes, we identified from a sample of 27 sequenced eukaryotic and 994 sequenced prokaryotic genomes 571 genes that were present in the eukaryote common ancestor and that have homologues among eubacterial and archaebacterial genomes. Maximum-likelihood trees identified the prokaryotic genomes that most frequently contained genes branching as the sister to the eukaryotic nuclear homologues. Among the archaebacteria, euryarchaeote genomes most frequently harbored the sister to the eukaryotic nuclear gene, whereas among eubacteria, the α-proteobacteria were most frequently represented within the sister group. Only 3 genes out of 571 gave a 3-domain tree. Homologues from α-proteobacterial genomes that branched as the sister to nuclear genes were found more frequently in genomes of facultatively anaerobic members of the rhiozobiales and rhodospirilliales than in obligate intracellular ricketttsial parasites. Following α-proteobacteria, the most frequent eubacterial sister lineages were γ-proteobacteria, δ-proteobacteria, and firmicutes, which were also the prokaryote genomes least frequently found as monophyletic groups in our trees. Although all 22 higher prokaryotic taxa sampled (crenarchaeotes, γ-proteobacteria, spirochaetes, chlamydias, etc.) harbor genes that branch as the sister to homologues present in the eukaryotic common ancestor, that is not evidence of 22 different prokaryotic cells participating at eukaryote origins because prokaryotic "lineages" have laterally acquired genes for more than 1.5 billion years since eukaryote origins. The data underscore the archaebacterial (host) nature of the eukaryotic informational genes and the eubacterial (mitochondrial) nature of eukaryotic energy metabolism. The network linking genes of the eukaryote ancestor to contemporary homologues distributed across prokaryotic genomes elucidates eukaryote gene origins in a dialect cognizant of gene transfer in nature.


Figures

F<sc>ig.</sc> 1.—
Fig. 1.—
A distribution of topologies among 712 inter-kingdom trees. The schematic trees on the right symbolize the branching patterns of eukaryotic and prokaryotic species observed in each category. (a) Eukaryotes and prokaryotes form monophyletic clades. (b) Eukaryotes are polyphyletic (≤6 eukaryotic species branch within the prokaryotic clade) and prokaryotes are paraphyletic. (c) Eukaryotes are paraphyletic (between 1 and 22 prokaryotic species branch within the eukaryotic clade) and prokaryotes are polyphyletic. (d) A mixed topology of eukaryotes and prokaryotes. The boxplots in the lower panel show the distribution of the number OTUs in trees where the eukaryotes are 1) monophyletic or 2) not monophyletic.
F<sc>ig</sc>. 2.—
Fig. 2.—
A presence–absence pattern (PAP) of the bacterial taxonomic groups in trees supporting the eukaryotic monophyly. The rows correspond to 571 trees in which the eukaryotes were monophyletic, the columns correspond to 22 bacterial groups. A cell i,j in the matrix is colored if tree i included a homologue from bacterial group j. Taxonomic groups harboring a gene that branches as a nearest neighbor to the eukaryotic clade in each tree are marked by a red cell. Taxonomic groups that are also present in the tree are marked by a gray cell. An asterisk indicates that species from the Chlamydiae, Verrumicrobia, and Plancomycetes taxa were combined into one group (PVC) (Wagner and Horn 2006). Group 1 included only trees where exactly one bacterial group was found, Group 2 included trees where 1) only Archaea were found, 2) only proteobacteria were found, and 3) were only eubacteria were found. Group 3 included all other trees. The black and white bars on the right indicate whether the KOG underlying the tree belongs to an informational (Inf.) or to an operational (Op.) class (Rivera et al. 1998). The numbers in the top panel indicate the following. US: The number of times that the given taxon was the only taxon in the sister group to the eukaryotic sequence (unique sisterhood, US). TS: the number of times that the taxon was either included in a unique sister group or in a sister group consisting of mixture of prokaryotic taxa total sisterhood (TS). SP: the number of sequenced strains from that taxon in our genome sample.
F<sc>ig.</sc> 3.—
Fig. 3.—
Proportion of archaeal sequences per alignment in the data set. The left bar graph shows the distribution of bacterial sequences in all trees where the eukaryotes form a monophyletic clade in bin intervals of 10. The plot on the right indicates the proportion of archaeabacterial sequences in each tree. There were only 68 archaea in the data, hence a skew distribution of trees containing many or mostly archaeabacterial sequences versus eubacterial sequences in alignments with more than 68 OTUs (see also fig. 4).
F<sc>ig.</sc> 4.—
Fig. 4.—
Three-dimensional bar graphs of prokaryotic groups found as sister groups to the eukaryotes distributed across functional categories according to KOG groups. The four main groups are information storage and processing (classes colored in blue), cellular processes and signaling (classes colored in green), metabolism (classes colored in gray), and poorly characterized proteins (classes colored in black). (a) Including the data from trees with 68 or fewer prokaryotic sequences. (b) Including the data from trees with more than 68 bacterial sequences. Bar height and color indicate how often a certain group was found in a tree belonging to a certain category.
F<sc>ig.</sc> 5.—
Fig. 5.—
Correlation between genome size and strain presence in the eukaryotic sister clade. (a) All archaebacterial species that were found as eukaryotic sisters plotted against their genome size. Correlation was measured using the spearman rang correlation, resulted in ρ = –0.1106, P = 0.3882. (b) All α-proteobacterial species that were found as eukaryotic sisters plotted against their genome size. Correlation was measured using the Spearman rang correlation, resulted in ρ = 0.4371 and P = 2.8 × 10⁻⁶.
F<sc>ig.</sc> 6.—
Fig. 6.—
Frequency of single α-proteobacterial species found on the shortest path to the eukaryotic clade, by summing up the branch lengths. For each of the respective sequences, the functional annotation is also given. Abbreviations refer to α-proteobacterial families. Rsp: Rhodospirillales, Rhiz: Rhizobiales, Rick: Rickettsiales, Rdb: Rhodobacterales, Sph: Sphingomonadales, and Caul: Caulobacterales.
F<sc>ig.</sc> 7.—
Fig. 7.—
Distribution of α-proteobacterial groups found as sister group to the eukaryotic clade. These presence absence matrix gives the functional description of all 104 trees (as rows) where the α-proteobacteria (106 different species, as columns) were found as the eukaryotic sister clade. The color indicates whether a group was found as sister clade (deep blue) or was just present in the tree (light blue). Abbreviations of α-proteobacterial families as given in the legend to figure 6.
F<sc>ig.</sc> 8.—
Fig. 8.—
Network linking apparent prokaryotic donors to the eukaryote common ancestor according to the present findings. This network based on a traditional phylogenetic tree to which lateral edges were added. Color intensity and width of the lateral edges reflect the frequencies with which these groups appear as sisters to the eukaryotic clade.
F<sc>ig.</sc> 9.—
Fig. 9.—
Lateral gene transfer between free-living prokaryotes subsequent to the origin of organelles requires that we think at least twice when interpreting phylogenetic trees for genes that were acquired from mitochondria (or chloroplasts, not shown). Genes that entered the eukaryotic lineage via the genome of the mitochondrial endosymbiont represent a genome-sized sample of prokaryotic gene diversity that existed at the time that mitochondria arose. The uniformly colored chromosomes at t0 indicate that at the time of mitochondrial origin, there existed for individual prokaryotes specific collections of genes in genomes, much like we see for strains of Escherichia coli today. If an E. coli cell would become an endosymbiont today, it would not introduce an E. coli pangenome’s worth of gene diversity (some 18,000 genes) into its host lineage, rather it would introduce some 4,500 genes or so. The free-living relatives of that endosymbiont would go on reassorting genes across chromosomes via gene transfer at the pangenome (species and strain) level, at the genus level, at the family level, and at the level of proteobacteria, the environment, and so forth. After 1.5 billion years, it would be very unreasonable to expect any contemporary prokaryote to harbor exactly the same collection of genes as the original endosymbiont did. Instead, the descendant genes of the endosymbiont (labeled blue in the figure) would be dispersed about myriad chromosomes, and we would eventually find them one at a time through genome sequencing of individuals from different groups. Though not shown here, for reasons of space limitation, exactly the same process also applies, in principle, for the host’s genome. Redrawn from Martin (1999b) and from figure 5 of Rujan and Martin (2001).

Similar articles

Cited by

References

    1. Abhishek A, Bavishi A, Choudhary M. Bacterial genome chimaerism and the origin of mitochondria. Can J Microbiol. 2011;57:49–61. - PubMed
    1. Altschul SF, et al. Gapped BLAST and PSI-BLAST: a new generation of protein database search programs. Nucleic Acids Res. 1997;25:3389–3402. - PMC - PubMed
    1. Atteia A, et al. Pyruvate formate-lyase and a novel route of eukaryotic ATP-synthesis in anaerobic Chlamydomonas mitochondria. J Biol Chem. 2006;281:9909–9918. - PubMed
    1. Atteia A, et al. A proteomic survey of Chlamydomonas reinhardtii mitochondria sheds new light on the metabolic plasticity of the organelle and on the nature of the α-proteobacterial mitochondrial ancestor. Mol Biol Evol. 2009;29:1533–1548. - PubMed
    1. Bapteste E, et al. Prokaryotic evolution and the tree of life are two different things. Biol Direct. 2009;4:34. - PMC - PubMed

Publication types