Comparative Study
. 2012 Jan;14(1):54-64.
doi: 10.1593/neo.111478.

Comparisons of the efficacy of a Jak1/2 inhibitor (AZD1480) with a VEGF signaling inhibitor (cediranib) and sham treatments in mouse tumors using DCE-MRI, DW-MRI, and histology

Affiliations
Comparative Study

Comparisons of the efficacy of a Jak1/2 inhibitor (AZD1480) with a VEGF signaling inhibitor (cediranib) and sham treatments in mouse tumors using DCE-MRI, DW-MRI, and histology

Mary E Loveless et al. Neoplasia. 2012 Jan.

Abstract

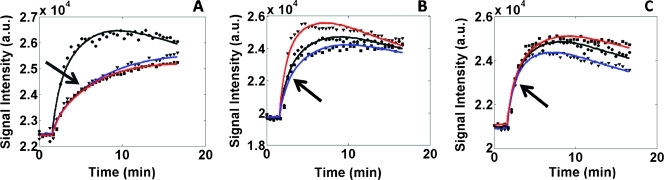
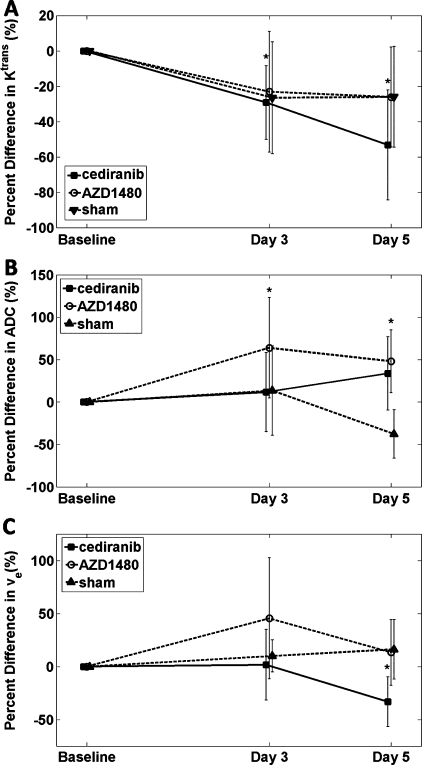
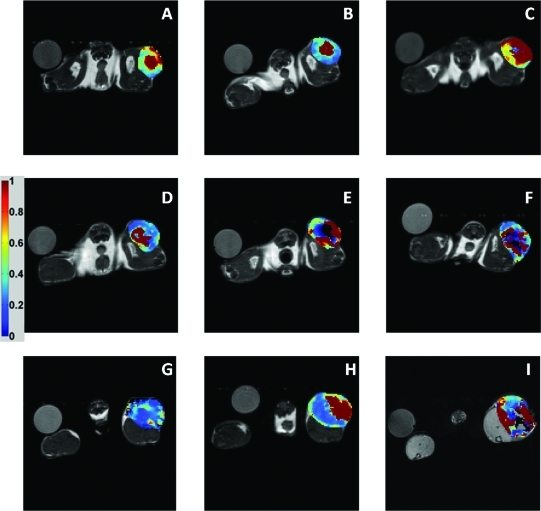
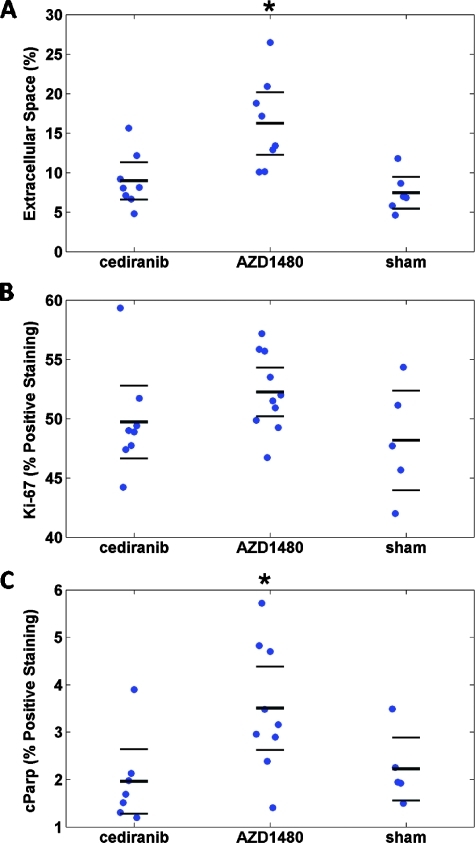
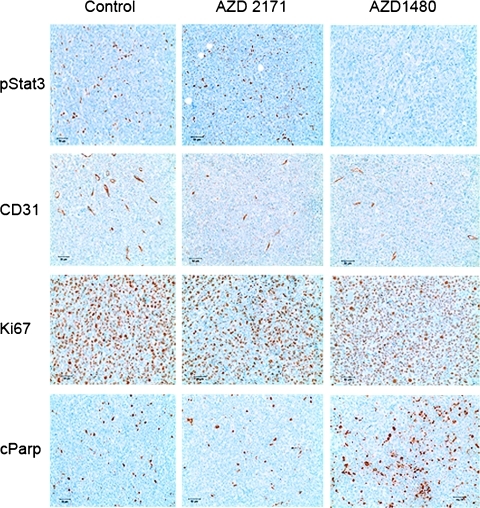
Jak1/2 inhibition suppresses STAT3 phosphorylation that is characteristic of many cancers. Activated STAT3 promotes the transcription of factors that enhance tumor growth, survival, and angiogenesis. AZD1480 is a novel small molecule inhibitor of Jak1/2, which is a key mediator of STAT3 activation. This study examined the use of diffusion-weighted (DW) and dynamic contrast-enhanced (DCE) magnetic resonance imaging (MRI) biomarkers in assessing early tumor response to AZD1480. Cediranib (AZD2171), a vascular endothelial growth factor signaling inhibitor, was used as a comparator. Thirty mice were injected with Calu-6 lung cancer cells and randomized into the three treatment groups: AZD1480, cediranib, and sham. DW-MRI and DCE-MRI protocols were performed at baseline and at days 3 and 5 after treatment. The percent change from baseline measurements for K(trans), ADC, and v(e) were calculated and compared with hematoxylin and eosin (H&E), CD31, cParp, and Ki-67 histology data. Decreases in K(trans) of 29% (P < .05) and 53% (P < .05) were observed at days 3 and 5, respectively, for the cediranib group. No significant changes in K(trans) occurred for the AZD1480 group, but a significant increase in ADC was demonstrated at days 3 (63%, P < .05) and 5 (49%, P < .05). CD31 staining indicated diminished vasculature in the cediranib group, whereas significantly increased cParp staining for apoptotic activity and extracellular space by image analysis of H&E were present in the AZD1480 group. These imaging biomarker changes, and corresponding histopathology, support the use of ADC, but not K(trans), as a pharmacodynamic biomarker of response to AZD1480 at these time points.


Figures

Figure 1
Figure 1
Volumetric data for all animals used in each treatment group. The solid square/solid line represents the cediranib group, whereas the open circle/dashed line represents the AZD1480. The sham group is represented by the triangle/dashed line with the vertical lines indicating the 95% confidence intervals for each time point. There is no significant difference between any of the groups at any time point (ncediranib = 12/nAZD1480 = 10/nsham = 9).
Figure 2
Figure 2
Example DCE-MRI curves from each treatment group. (A) Subject from the cediranib treatment group, with the black line indicating the baseline, the red line indicating day 3 data, and the blue line representing day 5 data. As noted by the arrow, there is dramatic decrease in Ktrans for the cediranib group. (B) ROI curves from the AZD1480 group, with the arrow showing that no specific pattern in Ktrans can be detected. (C) Sham group showing little detectable change in Ktrans values.
Figure 3
Figure 3
(A, B, and C) Percent change from baseline for Ktrans, ADC, and ve, respectively, from a center slice ROI where cediranib (▪), AZD1480 (○), and Sham (▴), whereas the 95% confidence intervals are represented by the vertical bars. *P < .05. Statistical significance was found for Ktrans in the cediranib treatment group, whereas AZD1480 days 3 and 5 data showed significant increases in ADC. A significant decrease was found for ve in the cediranib treatment group. See text for additional details.
Figure 4
Figure 4
Ktrans parametric maps for representative mice from each treatment group. The columns indicate baseline, day 3, and day 5 time points, whereas each row shows the cediranib (A–C), AZD1480 (D–F), and sham groups (G–I).
Figure 5
Figure 5
ADC parametric maps for a representative mouse from each treatment group. The columns indicate baseline, day 3, and day 5 time points, whereas each row shows the cediranib (A–C), AZD1480 (D–F), and sham groups (G–I).
Figure 6
Figure 6
ve parametric maps for a representative mouse from each treatment group. The columns indicate baseline, day 3, and day 5 time points, whereas each row shows the cediranib (A–C), AZD1480 (D–F), and sham groups (G–I).
Figure 7
Figure 7
Mean microvessel density calculated from CD31 staining in each treatment group. Bars, SD.
Figure 8
Figure 8
(A, B, and C) Cell density, Ki-67, and cParp staining results, respectively, for each group. Each “●” represents a sample with the bold solid line being the mean and the error bars above and below indicate the 95% confidence interval. (A) Cell density results as determined by H&E staining. (B) Percentage of nuclei that stained positive for Ki-67 activity. (C) Percentage of cParp-positive pixels.
Figure 9
Figure 9
Sample staining for pSTAT3 (first row), CD31 (second row), Ki-67 (third row), and cParp (last row) for sham group (first column), the cediranib treatment group (second column), and the AZD1480 treatment group (last column). There is clear evidence that pSTAT3 in AZD1480 is suppressed in treated animals (no brown staining). The brown staining shown in the CD31 staining indicates a positive stain for CD31 on endothelial cells, whereas a brown staining in the Ki-67 images indicates cells that are in a proliferative state. The brown staining for the cParp images indicate cells positive for the Parp cleavage typically characterized by cells undergoing apoptosis.

Similar articles

Cited by

References

    1. Dy GK, Adjei AA. Systemic cancer therapy: evolution over the last 60 years. Cancer. 2008;113:1857–1887. - PubMed
    1. Yu H, Jove R. The STATs of cancer—new molecular targets come of age. Nat Rev Cancer. 2004;4:97–105. - PubMed
    1. Bowman T, Broome MA, Sinibaldi D, Wharton W, Pledger WJ, Sedivy JM, Irby R, Yeatman T, Courtneidge SA, Jove R. Stat3-mediated Myc expression is required for Src transformation and PDGF-induced mitogenesis. Proc Natl Acad Sci USA. 2001;98:7319–7324. - PMC - PubMed
    1. Bowman T, Garcia R, Turkson J, Jove R. STATs in oncogenesis. Oncogene. 2000;19:2474–2488. - PubMed
    1. Niu G, Bowman T, Huang M, Shivers S, Reintgen D, Daud A, Chang A, Kraker A, Jove R, Yu H. Roles of activated Src and Stat3 signaling in melanoma tumor cell growth. Oncogene. 2002;21:7001–7010. - PubMed

Publication types

MeSH terms