

A tapered channel microfluidic device for comprehensive cell adhesion analysis, using measurements of detachment kinetics and shear stress-dependent motion
- PMID: 22355300
- PMCID: PMC3281936
- DOI: 10.1063/1.3673802
A tapered channel microfluidic device for comprehensive cell adhesion analysis, using measurements of detachment kinetics and shear stress-dependent motion
Abstract
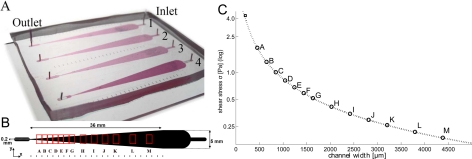
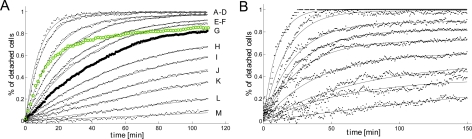
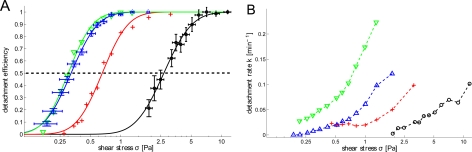
We have developed a method for studying cellular adhesion by using a custom-designed microfluidic device with parallel non-connected tapered channels. The design enables investigation of cellular responses to a large range of shear stress (ratio of 25) with a single input flow-rate. For each shear stress, a large number of cells are analyzed (500-1500 cells), providing statistically relevant data within a single experiment. Besides adhesion strength measurements, the microsystem presented in this paper enables in-depth analysis of cell detachment kinetics by real-time videomicroscopy. It offers the possibility to analyze adhesion-associated processes, such as migration or cell shape change, within the same experiment. To show the versatility of our device, we examined quantitatively cell adhesion by analyzing kinetics, adhesive strength and migration behaviour or cell shape modifications of the unicellular model cell organism Dictyostelium discoideum at 21 °C and of the human breast cancer cell line MDA-MB-231 at 37 °C. For both cell types, we found that the threshold stresses, which are necessary to detach the cells, follow lognormal distributions, and that the detachment process follows first order kinetics. In addition, for particular conditions' cells are found to exhibit similar adhesion threshold stresses, but very different detachment kinetics, revealing the importance of dynamics analysis to fully describe cell adhesion. With its rapid implementation and potential for parallel sample processing, such microsystem offers a highly controllable platform for exploring cell adhesion characteristics in a large set of environmental conditions and cell types, and could have wide applications across cell biology, tissue engineering, and cell screening.
Figures


Similar articles
-
A Microfluidic Design for Quantitative Measurements of Shear Stress-Dependent Adhesion and Motion of Dictyostelium discoideum Cells.Biomimetics (Basel). 2024 Oct 27;9(11):657. doi: 10.3390/biomimetics9110657. Biomimetics (Basel). 2024. PMID: 39590229 Free PMC article.
-
Shear stress-dependent cell detachment from temperature-responsive cell culture surfaces in a microfluidic device.Biomaterials. 2012 Oct;33(30):7405-11. doi: 10.1016/j.biomaterials.2012.06.077. Epub 2012 Jul 20. Biomaterials. 2012. PMID: 22818649
-
Shear flow-induced detachment kinetics of Dictyostelium discoideum cells from solid substrate.Biophys J. 2002 May;82(5):2383-95. doi: 10.1016/S0006-3495(02)75583-5. Biophys J. 2002. PMID: 11964228 Free PMC article.
-
Dictyostelium discoideum adhesion and motility under shear flow: experimental and theoretical approaches.J Muscle Res Cell Motil. 2002;23(7-8):651-8. doi: 10.1023/a:1024407107588. J Muscle Res Cell Motil. 2002. PMID: 12952064 Review.
-
Simulation of cell rolling and adhesion on surfaces in shear flow. Microvilli-coated hard spheres with adhesive springs.Cell Biophys. 1991 Apr;18(2):145-82. doi: 10.1007/BF02989811. Cell Biophys. 1991. PMID: 1726526 Review.
Cited by
-
Modulating wall shear stress gradient via equilateral triangular channel for in situ cellular adhesion assay.Biomicrofluidics. 2016 Oct 17;10(5):054119. doi: 10.1063/1.4965822. eCollection 2016 Sep. Biomicrofluidics. 2016. PMID: 27822327 Free PMC article.
-
The aerotaxis of Dictyostelium discoideum is independent of mitochondria, nitric oxide and oxidative stress.Front Cell Dev Biol. 2023 Jun 15;11:1134011. doi: 10.3389/fcell.2023.1134011. eCollection 2023. Front Cell Dev Biol. 2023. PMID: 37397260 Free PMC article.
-
Interplay between motility and cell-substratum adhesion in amoeboid cells.Biomicrofluidics. 2015 Sep 29;9(5):054112. doi: 10.1063/1.4931762. eCollection 2015 Sep. Biomicrofluidics. 2015. PMID: 26487898 Free PMC article.
-
Microfluidic platforms for mechanobiology.Lab Chip. 2013 Jun 21;13(12):2252-67. doi: 10.1039/c3lc41393d. Epub 2013 May 7. Lab Chip. 2013. PMID: 23649165 Free PMC article. Review.
-
A Review of Cell Adhesion Studies for Biomedical and Biological Applications.Int J Mol Sci. 2015 Aug 5;16(8):18149-84. doi: 10.3390/ijms160818149. Int J Mol Sci. 2015. PMID: 26251901 Free PMC article. Review.
References
LinkOut - more resources
Full Text Sources
Other Literature Sources
Miscellaneous