. 2012;7(2):e30614.
doi: 10.1371/journal.pone.0030614. Epub 2012 Feb 15.

Functional redundancy of two Pax-like proteins in transcriptional activation of cyst wall protein genes in Giardia lamblia

Affiliations

Functional redundancy of two Pax-like proteins in transcriptional activation of cyst wall protein genes in Giardia lamblia

Shen-Fung Chuang et al. PLoS One. 2012.

Abstract

The protozoan Giardia lamblia differentiates from a pathogenic trophozoite into an infectious cyst to survive outside of the host. During encystation, genes encoding cyst wall proteins (CWPs) are coordinately induced. Pax family transcription factors are involved in a variety of developmental processes in animals. Nine Pax proteins have been found to play an important role in tissue and organ development in humans. To understand the progression from primitive to more complex eukaryotic cells, we tried to identify putative pax genes in the G. lamblia genome and found two genes, pax1 and pax2, with limited similarity. We found that Pax1 may transactivate the encystation-induced cwp genes and interact with AT-rich initiatior elements that are essential for promoter activity and transcription start site selection. In this study, we further characterized Pax2 and found that, like Pax1, Pax2 was present in Giardia nuclei and it may specifically bind to the AT-rich initiator elements of the encystation-induced cwp1-3 and myb2 genes. Interestingly, overexpression of Pax2 increased the cwp1-3 and myb2 gene expression and cyst formation. Deletion of the C-terminal paired domain or mutation of the basic amino acids of the paired domain resulted in a decrease of nuclear localization, DNA-binding activity, and transactivation activity of Pax2. These results are similar to those found in the previous Pax1 study. In addition, the profiles of gene expression in the Pax2 and Pax1 overexpressing cells significantly overlap in the same direction and ERK1 associated complexes may phosphorylate Pax2 and Pax1, suggesting that Pax2 and Pax1 may be downstream components of a MAPK/ERK1 signaling pathway. Our results reveal functional redundancy between Pax2 and Pax1 in up-regulation of the key encystation-induced genes. These results illustrate functional redundancy of a gene family can occur in order to increase maintenance of important gene function in the protozoan organism G. lamblia.


Conflict of interest statement

Competing Interests: The authors have declared that no competing interests exist.

Figures

Figure 1
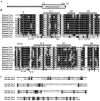
Figure 1. Domain architecture of Pax2 protein and alignment of the paired domains.
(A) Schematic representation of the giardial Pax2 protein. The gray boxes indicate the paired domains. (B) Alignment of the paired domains. The paired domains from members of the human and Drosophila Pax family are analyzed by ClustalW 1.83 . GenBank accession numbers for human Pax1 to 9 and Drosophila Prd are NM_006192, NM_000278, NM_181458, NM_006193, NM_016734, NM_000280, NM_001135254, NM_003466, NM_006194, and NM_164990, respectively. The open reading frame numbers (GenBank accession numbers) for the giardial Pax1 and Pax2 are 32686 (XM_001704983.1) and 16640 (XM_001709076.1) in the G. lamblia genome data base, respectively. Letters in black boxes, letters in gray boxes, and hyphens indicate identical amino acids, similar amino acids and gaps in the respective proteins, respectively. Gray boxes indicate the α helices in the paired domain of human Pax6 . The arrows indicate the key residues contacting the major groove in human Pax6 or Drosophila Prd , . The arrowheads indicate the residues that make contact with the minor groove/phosphodiester backbone in human Pax6 or Drosophila Prd , . Two regions (residues 185–205 and 226–248) rich in basic amino acid residues are underlined by dotted lines. (C) Alignment of N-terminal regions of giardial Pax2 and Pax1 ClustalW 1.83 . Letters in black boxes, letters in gray boxes, and hyphens indicate identical amino acids, similar amino acids and gaps in the respective proteins, respectively.
Figure 2
Figure 2. Analysis of pax2 gene expression.
(A) RT-PCR and quantitative real-time PCR analysis of pax2 gene expression. RNA samples were prepared from G. lamblia wild-type non-transfected WB cells cultured in growth (Veg, vegetative growth) or encystation medium and harvested at 24 h (Enc, encystation). RT-PCR was performed using primers specific for pax2, cwp1, ran, and 18S ribosomal RNA genes. Ribosomal RNA quality and loading controls are shown in the bottom panel. Representative results are shown on the left. Real-time PCR was performed using primers specific for pax2, cwp1, ran and 18S ribosomal RNA genes. Transcript levels were normalized to 18S ribosomal RNA levels. Fold changes in mRNA expression are shown as the ratio of transcript levels in encysting cells relative to vegetative cells. Results are expressed as the means ± standard error of at least three separate experiments (right panel). (B) Pax2 protein levels in different stages. The wild-type non-transfected WB cells were cultured in growth (Veg, vegetative growth) or encystation medium for 24 h (Enc, encystation) and then subjected to SDS-PAGE and Western blot. The blot was probed by anti-Pax2, anti-RAN, or anti-α tubulin antibody. Representative results are shown. Equal amounts of protein loading were confirmed by SDS-PAGE and Coomassie blue staining. (C) Diagrams of the 5′▵5N-Pac and pPPax2 plasmid. The pac gene (open box) is under the control of the 5′- and 3′-flanking regions of the gdh gene (striated box). In construct pPPax2, the pax2 gene is under the control of its own 5′-flanking region (open box) and the 3′-flanking region of the ran gene (dotted box). The filled black box indicates the coding sequence of the HA epitope tag. (D) Pax2 protein levels in pPPax2 stable transfectants. The pPPax2 stable transfectants were cultured in growth (Veg, vegetative growth) or encystation medium for 24 h (Enc, encystation) and then subjected to SDS-PAGE and Western blot. HA-tagged Pax2 protein was detected using an anti-HA antibody by Western blot analysis. The blot was also probed by anti-RAN or anti-α tubulin antibody. Equal amounts of protein loading were confirmed by SDS-PAGE and Coomassie blue staining. (E) Nuclear localization of Pax2. The pPPax2 stable transfectants were cultured in growth (Veg, left panels) or encystation medium for 24 h (Enc, right panels), and then subjected to immunofluorescence analysis using anti-HA antibody for detection. The product of pPPax2 localizes to the nuclei in both vegetative and encysting trophozoites (upper panels). The middle panels show the DAPI staining of cell nuclei. The bottom panels are the merged images of the DAPI staining and images of Pax2-HA.
Figure 3
Figure 3. Localization of Pax2 mutants.
(A) Diagrams of the Pax2 and Pax2m1-3 proteins. The gray box indicates the paired domain. Pax2m3 does not contain the C-terminal paired domain and C-terminal region (residues 172–302). Pax2m1 and Pax2m2 contain a mutation of two stretches of basic amino acids located inside of the paired domain (residues 185–205 for Pax2m1; residues 226–248 for Pax2m2). The pax2 gene was mutated and subcloned to replace the wild type pax2 gene in the backbone of pPPax2 (Figure 2C), and the resulting plasmids pPPax2m1-3 were transfected into Giardia. (B) Immunofluorescence analysis of Pax2m1-3 distribution. The pPPax2m1-3 stable transfectants were cultured in growth (Veg, vegetative growth) or encystation medium for 24 h (Enc, encystation) and then subjected to immunofluorescence analysis using anti-HA antibody for detection.
Figure 4
Figure 4. DNA-binding ability of Pax2 revealed by electrophoretic mobility shift assays.
(A) Western blot analysis of recombinant Pax2 protein with a V5 tag at its C terminus purified by affinity chromatography. The purified Pax2 protein is detected by anti-V5-HRP antibody (lane 2). E. coli lysate with the vector only (pET101/D-TOPO) was used as a negative control and no detection was observed for this control with anti-V5-HRP antibody (lane 1). (B) Detection of Pax2 binding sites. Electrophoretic mobility shift assays were performed using purified Pax2 and the 32P-end-lableled oligonucleotide probe cwp1-45/−1 (−45 to −1 relative to the translation start site of the cwp1 gene). Components in the binding reaction mixtures are indicated above the lanes. The Pax2 binding specificity for the cwp1-45/−1 probe was confirmed by competition and supershift assays. Some reaction mixtures contained 200-fold molar excess of cold oligonucleotides cwp1-45/−1 or ran-30/−1 or 0.8 µg of anti-V5 antibody, as indicated above the lanes. The arrowhead indicates the shifted complex. The transcription start site of the cwp1 gene determined from 24-h encysting cells is indicated by an asterisk . The AT-rich Inr element spanning the transcription start site is underlined.
Figure 5
Figure 5. Mutation analysis of the cwp1-45/−1 probe sequence containing the putative Pax2 binding site.
Electrophoretic mobility shift assays were performed using purified Pax2 and various 32P end-labeled cwp1-45/−1 mutant probes as described. Base changes in the mutants are shown in underlined lowercase type. Components in the binding reaction mixtures are indicated above the lanes. The arrowhead indicates the shifted complex. The transcription start site of the cwp1 gene determined from 24-h encysting cells is indicated by an asterisk . The AT-rich Inr element spanning the transcription start site is underlined. “+”, “+/−”, and “−” represent moderate binding, weak binding, and no binding, respectively. “+++” and “++” represent strong binding.
Figure 6
Figure 6. Detection of Pax2 binding sites in multiple promoters.
Electrophoretic mobility shift assays were performed using purified Pax2 and various 32P-end-lableled oligonucleotide probes as described. Components in the binding reaction mixtures are indicated above the lanes. The arrowhead indicates the shifted complex. The transcription start sites of the cwp2, cwp3, and myb2 genes determined from 24-h encysting cells are indicated by asterisks , . The transcription start sites of the ran gene determined from vegetative cells are indicated by asterisks . The AT-rich Inr elements spanning the transcription start sites are underlined. The translation start sites of the cwp2 and cwp3 genes are framed. “18S” represents 18S ribosomal RNA. “+”, “+/−”, and “−” represent moderate binding, weak binding, and no binding, respectively. “+++” and “++” represent strong binding.
Figure 7
Figure 7. Analysis of Pax2 binding ability.
(A) Pax2 may bind to AT-rich sequence. Electrophoretic mobility shift assays were performed using purified Pax2 and various 32P-end-lableled oligonucleotide probes as described. Components in the binding reaction mixtures are indicated above the lanes. The arrowhead indicates the shifted complex. “+”, “+/−”, and “−” represent moderate binding, weak binding, and no binding, respectively. “+++” and “++” represent strong binding. (B) Effect of distamycin A on the binding of Pax2 to DNA. 32P end-labeled cwp1-45/−1 probe was incubated with Pax2 in the absence (lane 1) or presence of distamycin A (lanes 3–7). The arrowhead indicates the shifted complex. DistamycinA was dissolved in Me2SO. Adding Me2SO to the reaction mix did not decrease the Pax2 binding activity (lane 2).
Figure 8
Figure 8. Activation of cwp1-3 and myb2 gene expression in the Pax2 overexpressing cell line.
(A) Overexpression of Pax2 increased the levels of CWP1 protein. The 5′▵5N-Pac, pPPax2, and pPPax2m1-3 stable transfectants were cultured in growth medium and then subjected to SDS-PAGE and Western blot. The blot was probed by anti-Pax2, anti-HA and anti-CWP1 antibody. Equal amounts of protein loading were confirmed by SDS-PAGE and Coomassie blue staining. Representative results are shown. (B) RT-PCR analysis of gene expression in the Pax2 and Pax2m1-3 overexpressing cell lines. The 5′▵5N-Pac, pPPax2, and pPPax2m1-3 stable transfectants were cultured in growth medium and then subjected to RT-PCR analysis using primers specific for pax2-ha, pax2, cwp1, cwp2, cwp3, myb2, ran, and 18S ribosomal RNA genes. (C) Quantitative real-time PCR analysis of gene expression in the Pax2 and Pax2m1-3 overexpressing cell lines. Real-time PCR was performed using primers specific for pax2-ha, pax2, cwp1, cwp2, cwp3, myb2, ran, and 18S ribosomal RNA genes. Similar mRNA levels of the ran and 18S ribosomal RNA genes for these samples were detected. Transcript levels were normalized to 18S ribosomal RNA levels. Fold changes in mRNA expression are shown as the ratio of transcript levels in the pPPax2 or pPPax2m1-3 cell line relative to the 5′▵5N-Pac cell line. Results are expressed as the means ± standard error of at least three separate experiments. (D) Cyst count. The 5′▵5N-Pac, 5′▵5N-Pac, pPPax2, and pPPax2m1-3 stable transfectants were cultured in growth medium and then subjected to cyst count as described under “ Methods ”. The sum of total cysts is expressed as relative expression level over control. Values are shown as means ± standard error.
Figure 9
Figure 9. Recruitment of Pax2 to the cwp1-3 and myb2 promoters.
(A) Microarray analysis. Microarray data were obtained from the 5′▵5N-Pac and pPPax1 (or pPPax2) cell lines during vegetative growth. Fold changes are shown as the ratio of transcript levels in the pPPax1 (or pPPax2) cell line relative to the 5′▵5N-Pac cell line. Results are expressed as the means ± standard error of at least three separate experiments. (B) Pax2 and Pax1 overexpression generated similar gene expression patterns. The Venn diagrams illustrate the overlap of altered gene expression between the Pax2 and Pax1 overexpressing cells. Thirty eight and 185 genes were up-regulated (i.e. increased levels of gene expression relative to the control) in the Pax1 and Pax2 overexpressing cells, respectively. Among them, nineteen genes overlap. Fifty four and 172 genes were down-regulated in the Pax1 and Pax2 overexpressing cells, respectively. Among them, thirty genes overlap. (C) ChIP assays. The non-transfected WB cells were cultured in growth medium for 24 h and then subjected to ChIP assays. Anti-Pax2 antibody was used to assess binding of Pax2 to endogenous gene promoters. Preimmune serum was used as a negative control. Immunoprecipitated chromatin was analyzed by PCR using primers that amplify the 5′-flanking region of specific genes. At least three independent experiments were performed. Representative results are shown. Immunoprecipitated products of Pax2 yielded more PCR products of pax2, cwp1, cwp2, cwp3, myb2, and ran promoters, indicating that Pax2 was bound to these promoters. The 18S ribosomal RNA gene promoter was used as a negative control for our ChIP analysis.
Figure 10
Figure 10. Phosphorylation of Pax2 and Pax1 proteins by ERK1 associated complexes.
(A) Diagrams of the pPERK1 and pPERK1m plasmids. The pac gene (open box) expression cassette is the same as in Figure 2C. The erk1 gene is under the control of its own 5′-flanking region (open boxes) and the 3′-flanking region of the ran gene (dotted box). ERK1m does not contain the predicted kinase domain (residues 26–202)(gray box). The filled box indicates the coding sequence of the HA epitope tag. (B) Similar levels of immunoprecipitated ERK1 protein from the vegetative and encysting pPERK1 cultures used in kinase assays. The pPERK1 stable transfectants were cultured in growth (Veg, vegetative growth) or encystation medium for 24 h (Enc, encystation) and then subjected to IP-kinase assays using anti-HA antibody. The addition of similar levels of the HA-tagged ERK1 protein from the vegetative and encysting pPERK1 cultures in each kinase reaction was confirmed by Western blot using an anti-HA antibody (left panel). The addition of similar levels of the HA-tagged ERK1 protein from the encysting pPERK1, and pPERK1m cultures in each kinase reaction was confirmed by Western blot using an anti-HA antibody (right panel). Equal amounts of protein loading were confirmed by SDS-PAGE and Coomassie blue staining. (C) Encystation-induced kinase activity of ERK1 for Pax2 substrate. The pPERK1 stable transfectants were cultured in growth (Veg, vegetative growth) or encystation medium for 24 h (Enc, encystation) and then subjected to IP-kinase assays using anti-HA antibody. Kinase activity was measured using purified recombinant Pax2 as a substrate. As a negative control, an IP-kinase assay was performed with the encysting 5′▵5N-Pac cultures which did not express the HA-tagged ERK1 protein (lane 5). Another IP-kinase assay was performed with the encysting pPERK1m cultures which expressed the ERK1m-HA protein without the predicted kinase domain (residues 26–202) (lane 7). To account for ERK1 autophosphorylation, an additional control without substrate but with immunoprecipitated ERK1-HA was also included (lane 1). (D) Encystation-induced kinase activity of ERK1 for Pax1 substrate. IP-kinase assays were performed as described above, except that Pax1 substrate was used.
Figure 11
Figure 11. Interaction between ERK1 and Pax2 (or Pax1).
(A) Co-immunoprecipitation assay. The 5′Δ5N-Pac, pPERK1, and pPERK1m stable transfectants were cultured in encystation medium for 24 h. Proteins from cell lysates were immunoprecipitated using anti-HA antibody conjugated to beads. The precipitates were analyzed by Western blot with anti-HA, anti-Pax2, or anti-Pax1 antibody as indicated. (B) Expression of HA tagged ERK1, Pax2, and Pax1 proteins in whole cell extracts. The 5′Δ5N-Pac, pPERK1, and pPERK1m stable transfectants were cultured in encystation medium for 24 h (Enc, encystation) and then subjected to Western blot analysis. The blot was probed by anti-HA, anti-Pax2, anti-Pax1, and anti-RAN antibody. Equal amounts of protein loading were confirmed by SDS-PAGE and Coomassie blue staining. (C) RT-PCR analysis of gene expression in the ERK1- and ERK1m-overexpressing cell line. The 5′Δ5N-Pac, pPERK1, and pPERK1m stable transfectants were cultured in encystation medium for 24 h (Enc, encystation) and then subjected to RT-PCR analysis. PCR was performed using primers specific for pax2, pax1, ran, and 18S ribosomal RNA genes.

Similar articles

Cited by

References

    1. Adam RD. Biology of Giardia lamblia. Clin Microbiol Rev. 2001;14:447–475. - PMC - PubMed
    1. Ankarklev J, Jerlström-Hultqvist J, Ringqvist E, Troell K, Svärd SG. Behind the smile: cell biology and disease mechanisms of Giardia species. Nat Rev Microbiol. 2010;8:413–422. - PubMed
    1. Robertson LJ, Hanevik K, Escobedo AA, Mørch K, Langeland N. Giardiasis–why do the symptoms sometimes never stop? Trends Parasitol. 2010;26:75–82. - PubMed
    1. Stark D, van Hal S, Marriott D, Ellis J, Harkness J. Irritable bowel syndrome: a review on the role of intestinal protozoa and the importance of their detection and diagnosis. Int J Parasitol. 2007;37:11–20. - PubMed
    1. Hanevik K, Dizdar V, Langeland N, Hausken T. Development of functional gastrointestinal disorders after Giardia lamblia infection. BMC Gastroenterol. 2009;9:27. - PMC - PubMed

Publication types

MeSH terms