

PIPS: pathogenicity island prediction software
- PMID: 22355329
- PMCID: PMC3280268
- DOI: 10.1371/journal.pone.0030848
PIPS: pathogenicity island prediction software
Abstract
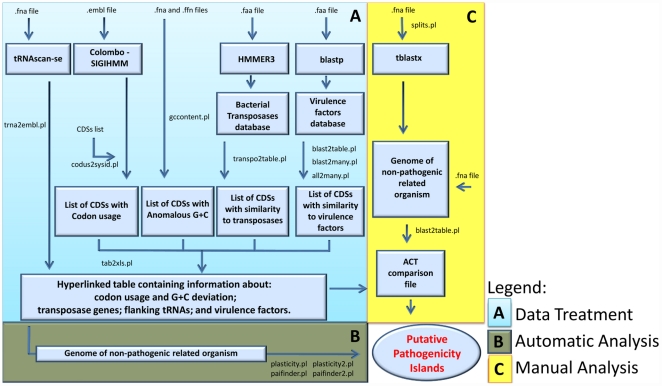
The adaptability of pathogenic bacteria to hosts is influenced by the genomic plasticity of the bacteria, which can be increased by such mechanisms as horizontal gene transfer. Pathogenicity islands play a major role in this type of gene transfer because they are large, horizontally acquired regions that harbor clusters of virulence genes that mediate the adhesion, colonization, invasion, immune system evasion, and toxigenic properties of the acceptor organism. Currently, pathogenicity islands are mainly identified in silico based on various characteristic features: (1) deviations in codon usage, G+C content or dinucleotide frequency and (2) insertion sequences and/or tRNA genetic flanking regions together with transposase coding genes. Several computational techniques for identifying pathogenicity islands exist. However, most of these techniques are only directed at the detection of horizontally transferred genes and/or the absence of certain genomic regions of the pathogenic bacterium in closely related non-pathogenic species. Here, we present a novel software suite designed for the prediction of pathogenicity islands (pathogenicity island prediction software, or PIPS). In contrast to other existing tools, our approach is capable of utilizing multiple features for pathogenicity island detection in an integrative manner. We show that PIPS provides better accuracy than other available software packages. As an example, we used PIPS to study the veterinary pathogen Corynebacterium pseudotuberculosis, in which we identified seven putative pathogenicity islands.
Conflict of interest statement
Figures
Similar articles
-
GIPSy: Genomic island prediction software.J Biotechnol. 2016 Aug 20;232:2-11. doi: 10.1016/j.jbiotec.2015.09.008. Epub 2015 Sep 12. J Biotechnol. 2016. PMID: 26376473
-
[Plasticity of bacterial genomes: pathogenicity islands and the locus of enterocyte effacement (LEE)].Berl Munch Tierarztl Wochenschr. 2004 Mar-Apr;117(3-4):116-29. Berl Munch Tierarztl Wochenschr. 2004. PMID: 15046458 Review. German.
-
Identification and characterization of pathogenicity and other genomic islands using base composition analyses.Future Microbiol. 2006 Oct;1(3):309-16. doi: 10.2217/17460913.1.3.309. Future Microbiol. 2006. PMID: 17661643 Review.
-
A computational approach for identifying pathogenicity islands in prokaryotic genomes.BMC Bioinformatics. 2005 Jul 21;6:184. doi: 10.1186/1471-2105-6-184. BMC Bioinformatics. 2005. PMID: 16033657 Free PMC article.
-
Pathogenicity islands: a molecular toolbox for bacterial virulence.Cell Microbiol. 2006 Nov;8(11):1707-19. doi: 10.1111/j.1462-5822.2006.00794.x. Epub 2006 Aug 24. Cell Microbiol. 2006. PMID: 16939533 Review.
Cited by
-
Tips and tricks for the assembly of a Corynebacterium pseudotuberculosis genome using a semiconductor sequencer.Microb Biotechnol. 2013 Mar;6(2):150-6. doi: 10.1111/1751-7915.12006. Epub 2012 Dec 2. Microb Biotechnol. 2013. PMID: 23199210 Free PMC article.
-
Genome informatics and vaccine targets in Corynebacterium urealyticum using two whole genomes, comparative genomics, and reverse vaccinology.BMC Genomics. 2015;16 Suppl 5(Suppl 5):S7. doi: 10.1186/1471-2164-16-S5-S7. Epub 2015 May 26. BMC Genomics. 2015. PMID: 26041051 Free PMC article.
-
Comparative Analysis of Genomic Island Prediction Tools.Front Genet. 2018 Dec 12;9:619. doi: 10.3389/fgene.2018.00619. eCollection 2018. Front Genet. 2018. PMID: 30631340 Free PMC article.
-
Characterization of the core and accessory genomes of Pseudomonas aeruginosa using bioinformatic tools Spine and AGEnt.BMC Genomics. 2014 Aug 29;15(1):737. doi: 10.1186/1471-2164-15-737. BMC Genomics. 2014. PMID: 25168460 Free PMC article.
-
Pan-Genome Plasticity and Virulence Factors: A Natural Treasure Trove for Acinetobacter baumannii.Antibiotics (Basel). 2024 Mar 14;13(3):257. doi: 10.3390/antibiotics13030257. Antibiotics (Basel). 2024. PMID: 38534692 Free PMC article. Review.
References
-
- Dobrindt U, Hacker J. Whole genome plasticity in pathogenic bacteria. Curr Opin Microbiol. 2001;4:550–557. - PubMed
-
- Hacker J, Bender L, Ott M, Wingender J, Lund B, et al. Deletions of chromosomal regions coding for fimbriae and hemolysins occur in vitro and in vivo in various extraintestinal Escherichia coli isolates. Microb Pathog. 1990;8:213–225. - PubMed
Publication types
MeSH terms
LinkOut - more resources
Full Text Sources
Medical
Research Materials
