. 2012;7(2):e31621.
doi: 10.1371/journal.pone.0031621. Epub 2012 Feb 15.

High resolution methylome map of rat indicates role of intragenic DNA methylation in identification of coding region

Affiliations

High resolution methylome map of rat indicates role of intragenic DNA methylation in identification of coding region

Satish Sati et al. PLoS One. 2012.

Abstract

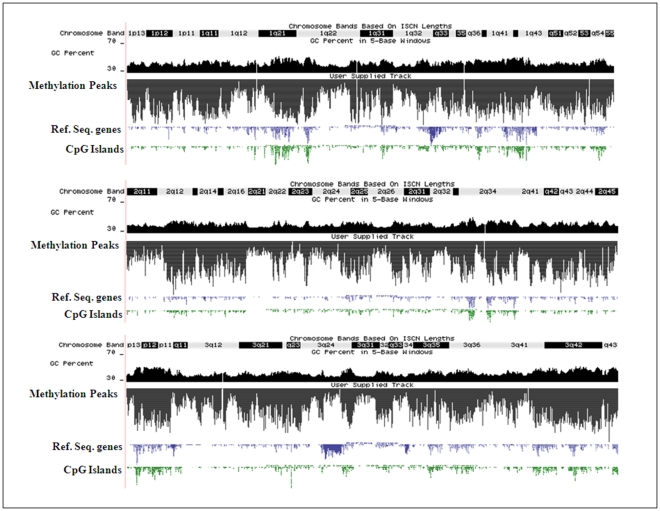
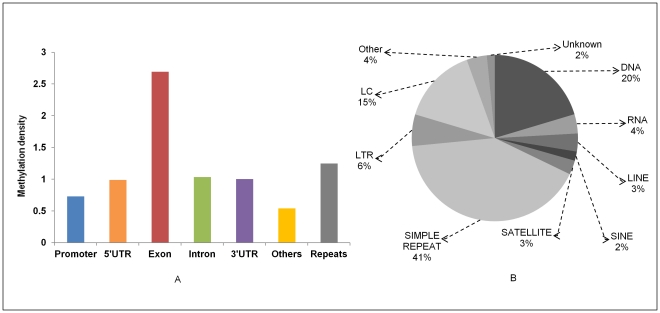
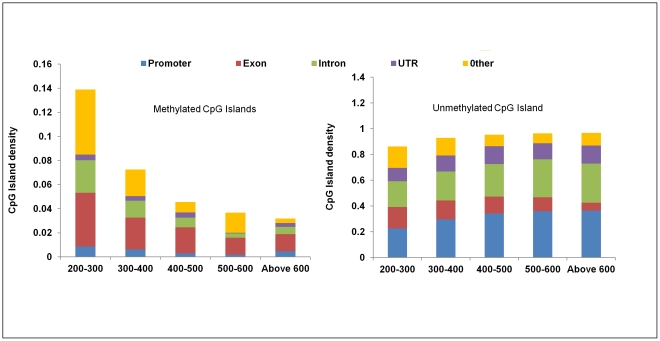
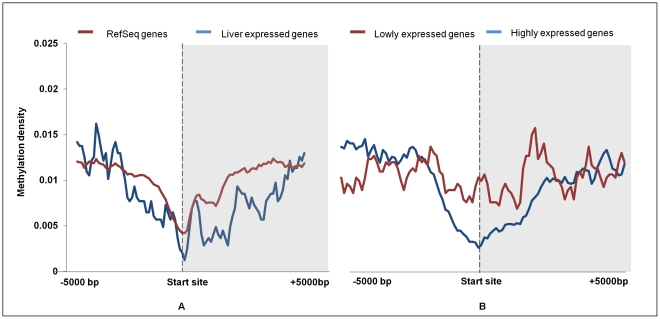
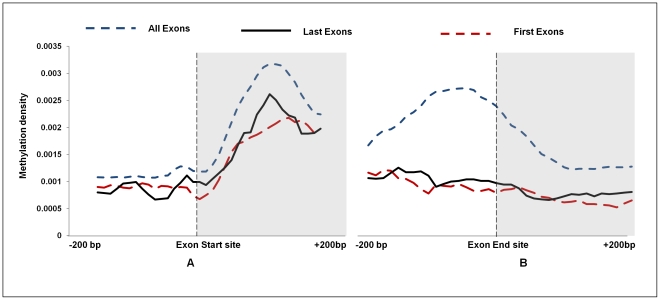
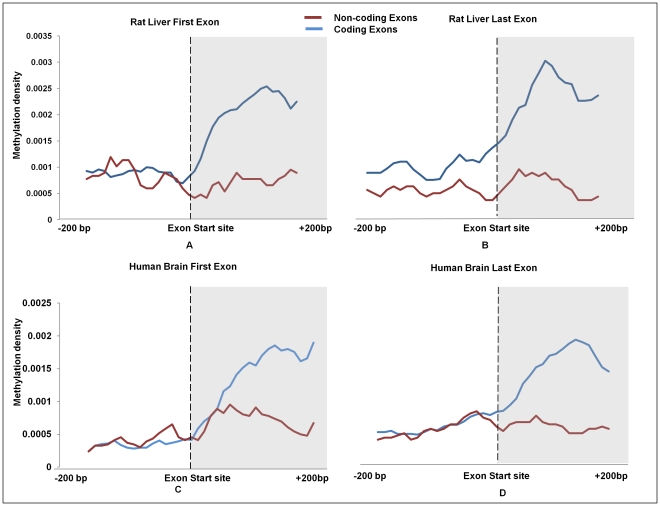
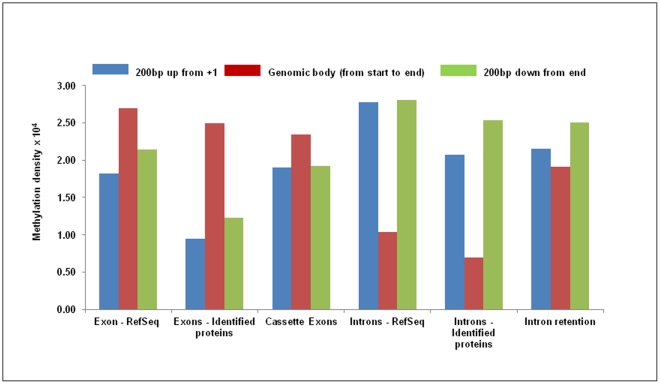
DNA methylation is crucial for gene regulation and maintenance of genomic stability. Rat has been a key model system in understanding mammalian systemic physiology, however detailed rat methylome remains uncharacterized till date. Here, we present the first high resolution methylome of rat liver generated using Methylated DNA immunoprecipitation and high throughput sequencing (MeDIP-Seq) approach. We observed that within the DNA/RNA repeat elements, simple repeats harbor the highest degree of methylation. Promoter hypomethylation and exon hypermethylation were common features in both RefSeq genes and expressed genes (as evaluated by proteomic approach). We also found that although CpG islands were generally hypomethylated, about 6% of them were methylated and a large proportion (37%) of methylated islands fell within the exons. Notably, we obeserved significant differences in methylation of terminal exons (UTRs); methylation being more pronounced in coding/partially coding exons compared to the non-coding exons. Further, events like alternate exon splicing (cassette exon) and intron retentions were marked by DNA methylation and these regions are retained in the final transcript. Thus, we suggest that DNA methylation could play a crucial role in marking coding regions thereby regulating alternative splicing. Apart from generating the first high resolution methylome map of rat liver tissue, the present study provides several critical insights into methylome organization and extends our understanding of interplay between epigenome, gene expression and genome stability.


Conflict of interest statement

Competing Interests: The authors have declared that no competing interests exist.

Figures

Figure 1
Figure 1. Chromosomal distribution of DNA methylation.
Graphical representation of chromosome wide distribution of methylation peaks of chromosome 1, 2 and 3 along with their GC percentage (dark black color), Refseq genes (blue color), CpG Islands (green color), and chromosome band in UCSC Genome Browser.
Figure 2
Figure 2. Methylation density in different genomic regions.
Methylation density within promoter, gene body and repeats was calculated by dividing the peak summit count in that region by the area of that region. Further repeats were classified in different classes and average methylation level of each class was calculated and plotted.
Figure 3
Figure 3. Genomic distribution of methylated and unmethylated CGI.
CpG Island of each methylated and unmethylated Islands were classified in different bins on the basis of size. A – Number of methylated CpG Islands in a particular bin was calculated in different regions like intron, exon, promoter (5 kb upstream from the transcription start site) and rest was put in others category. The count was then normalized by the total number of CpG Island in that bin. B – Number of unmethylated CpG Island of bin was calculated in different regions like intron, exon, promoter (5 kb upstream from the transcription start site) and others, and the count was then normalized by the total number of CpG Islands in that bin.
Figure 4
Figure 4. Average methylation density around transcription start site (TSS).
A - Distribution of peak summit count in 100 bp sliding window, 5 kb upstream and downstream from the start site was calculated for all RefSeq genes and identified liver proteins. Count was normalized by dividing individual count with total number of genes in that category. The plot obtained of RefSeq and identified liver proteins were further smoothened by taking a moving average of 5. B – Similar distribution of peak summit count in 100 bp sliding window, 5 kb upstream and downstream from the transcription start site was calculated for up regulated and down regulated genes in normal rat liver tissue. Smoothing of peaks was done by taking moving average of 5.
Figure 5
Figure 5. Average methylation density at the intron-exon-intron junctions.
Distribution of peak summit count in 10 bp sliding window, 200 bp upstream and downstream from the start site and end site of exons was calculated for all RefSeq gene exons, first exon and all last exons. Smoothing of peaks was done by taking moving average of 5.
Figure 6
Figure 6. Methylation distribution of first and last exons based on presence and absence of coding region.
The first and last exons were further classified as coding exons and non-coding exons based on the fact that they contain coding region within them or not. (a), (b) represents the methylation of rat RefSeq first exon and last exons while (c), (d) represent the methylation pattern in Human RefSeq first exon and last exons plotted using the MeDIP-Seq data from Human brain tissue. Distribution of peak summit count in 10 bp sliding window, 200 bp upstream and downstream from the start site and end site of exons was calculated for first exon and all last exons. Smoothing of peaks was done by taking moving average of 5.
Figure 7
Figure 7. Methylation marks the coding region.
Third exon of the Ccdc 75 gene shows methylation in MeDIP-Seq data as visualized in UCSC genome browser.
Figure 8
Figure 8. Methylation in alternate splice events.
Methylation in genomic features along with Intron retention class of alternative splicing events was calculated. Genomic features include RefSeq exons, introns, identified liver expressed gene exons and introns. Three bins were created: 1) 200 bp upstream from start site of the event, 2) from start site to end of the event, 3) 200 bp downstream from the end. Peak summit count obtained in all bins was normalized by dividing the count with the area of that bin. Distribution of peak summit count in 10 bp sliding window, 200 bp upstream and downstream from the start site of all RefSeq exons and cassette exons.

Similar articles

Cited by

References

    1. Bernstein BE, Meissner A, Lander ES. The mammalian epigenome. Cell. 2007;128:669–681. - PubMed
    1. Szyf M. The dynamic epigenome and its implications in toxicology. Toxicol Sci. 2007;100:7–23. - PubMed
    1. Bird A. DNA methylation patterns and epigenetic memory. Genes Dev. 2002;16:6–21. - PubMed
    1. Kelly TK, De Carvalho DD, Jones PA. Epigenetic modifications as therapeutic targets. Nat Biotechnol. 2010;28:1069–1078. - PMC - PubMed
    1. Petronis A. Epigenetics as a unifying principle in the aetiology of complex traits and diseases. Nature. 2010;465:721–727. - PubMed

Publication types

Associated data