Regional brain differences in cortical thickness, surface area and subcortical volume in individuals with Williams syndrome
- PMID: 22355403
- PMCID: PMC3280212
- DOI: 10.1371/journal.pone.0031913
Regional brain differences in cortical thickness, surface area and subcortical volume in individuals with Williams syndrome
Erratum in
- PLoS One. 2012;7(5): doi/10.1371/annotation/e4ec835e-932f-4956-b9fd-7113eee67347
Abstract
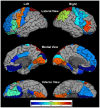
Williams syndrome (WS) is a rare genetic neurodevelopmental disorder characterized by increased non-social anxiety, sensitivity to sounds and hypersociability. Previous studies have reported contradictory findings with regard to regional brain variation in WS, relying on only one type of morphological measure (usually volume) in each study. The present study aims to contribute to this body of literature and perhaps elucidate some of these discrepancies by examining concurrent measures of cortical thickness, surface area and subcortical volume between WS subjects and typically-developing (TD) controls. High resolution MRI scans were obtained on 31 WS subjects and 50 typically developing control subjects. We derived quantitative regional estimates of cortical thickness, cortical surface area, and subcortical volume using FreeSurfer software. We evaluated between-group ROI differences while controlling for total intracranial volume. In post-hoc exploratory analyses within the WS group, we tested for correlations between regional brain variation and Beck Anxiety Inventory scores. Consistent with our hypothesis, we detected complex patterns of between-group cortical variation, which included lower surface area in combination with greater thickness in the following cortical regions: post central gyrus, cuneus, lateral orbitofrontal cortex and lingual gyrus. Additional cortical regions showed between-group differences in one (but not both) morphological measures. Subcortical volume was lower in the basal ganglia and the hippocampus in WS versus TD controls. Exploratory correlations revealed that anxiety scores were negatively correlated with gray matter surface area in insula, OFC, rostral middle frontal, superior temporal and lingual gyrus. Our results were consistent with previous reports showing structural alterations in regions supporting the socio-affective and visuospatial impairments in WS. However, we also were able to effectively capture novel and complex patterns of cortical differences using both surface area and thickness. In addition, correlation results implicate specific brain regions in levels of anxiety in WS, consistent with previous reports investigating general anxiety disorders in the general population.
Conflict of interest statement
Figures


Similar articles
-
Abnormal cortical complexity and thickness profiles mapped in Williams syndrome.J Neurosci. 2005 Apr 20;25(16):4146-58. doi: 10.1523/JNEUROSCI.0165-05.2005. J Neurosci. 2005. PMID: 15843618 Free PMC article.
-
Surface-based morphometry reveals distinct cortical thickness and surface area profiles in Williams syndrome.Am J Med Genet B Neuropsychiatr Genet. 2016 Apr;171B(3):402-13. doi: 10.1002/ajmg.b.32422. Epub 2016 Feb 7. Am J Med Genet B Neuropsychiatr Genet. 2016. PMID: 26852730
-
Gray Matter Abnormalities in Non-comorbid Medication-naive Patients with Major Depressive Disorder or Social Anxiety Disorder.EBioMedicine. 2017 Jul;21:228-235. doi: 10.1016/j.ebiom.2017.06.013. Epub 2017 Jun 15. EBioMedicine. 2017. PMID: 28633986 Free PMC article.
-
Cortical and Subcortical Gray Matter Volume in Youths With Conduct Problems: A Meta-analysis.JAMA Psychiatry. 2016 Jan;73(1):64-72. doi: 10.1001/jamapsychiatry.2015.2423. JAMA Psychiatry. 2016. PMID: 26650724 Review.
-
Brain abnormalities in Williams syndrome: a review of structural and functional magnetic resonance imaging findings.Eur J Paediatr Neurol. 2009 Jul;13(4):305-16. doi: 10.1016/j.ejpn.2008.07.002. Epub 2008 Aug 21. Eur J Paediatr Neurol. 2009. PMID: 18722146 Review.
Cited by
-
Williams Syndrome, Human Self-Domestication, and Language Evolution.Front Psychol. 2019 Mar 18;10:521. doi: 10.3389/fpsyg.2019.00521. eCollection 2019. Front Psychol. 2019. PMID: 30936846 Free PMC article.
-
Structural abnormalities in cortical volume, thickness, and surface area in 22q11.2 microdeletion syndrome: Relationship with psychotic symptoms.Neuroimage Clin. 2013 Oct 14;3:405-15. doi: 10.1016/j.nicl.2013.09.013. eCollection 2013. Neuroimage Clin. 2013. PMID: 24273724 Free PMC article.
-
The Role of Prefrontal Cortical Surface Area and Volume in Preclinical Suicidal Ideation in a Non-Clinical Sample.Front Psychiatry. 2019 Jun 21;10:445. doi: 10.3389/fpsyt.2019.00445. eCollection 2019. Front Psychiatry. 2019. PMID: 31312146 Free PMC article.
-
Grey matter volume and cortical structure in Prader-Willi syndrome compared to typically developing young adults.Neuroimage Clin. 2017 Dec 20;17:899-909. doi: 10.1016/j.nicl.2017.12.027. eCollection 2018. Neuroimage Clin. 2017. PMID: 29527494 Free PMC article.
-
Typical and atypical brain development: a review of neuroimaging studies.Dialogues Clin Neurosci. 2013 Sep;15(3):359-84. doi: 10.31887/DCNS.2013.15.3/edennis. Dialogues Clin Neurosci. 2013. PMID: 24174907 Free PMC article. Review.
References
-
- Dykens EM. Anxiety, fears, and phobias in persons with Williams syndrome. Dev Neuropsychol. 2003;23:291–316. - PubMed
-
- Morris CA. The behavioral phenotype of Williams syndrome: A recognizable pattern of neurodevelopment. Am J Med Genet C Semin Med Genet. 2010;154C:427–431. - PubMed
-
- Dykens EM, Rosner BA, Ly T, Sagun J. Music and anxiety in Williams syndrome: a harmonious or discordant relationship? Am J Ment Retard. 2005;110:346–358. - PubMed
-
- Mobbs D, Eckert MA, Mills D, Korenberg J, Bellugi U, et al. Frontostriatal dysfunction during response inhibition in Williams syndrome. Biol Psychiatry. 2007;62:256–261. - PubMed
Publication types
MeSH terms
Grants and funding
LinkOut - more resources
Full Text Sources

