

Combined effects of prevention and quarantine on a breakout in SIR model
- PMID: 22355529
- PMCID: PMC3216498
- DOI: 10.1038/srep00010
Combined effects of prevention and quarantine on a breakout in SIR model
Abstract
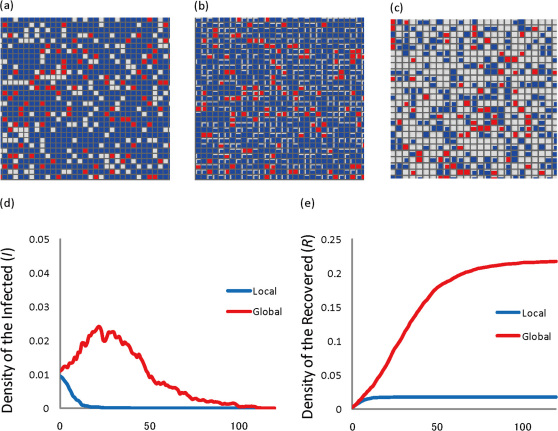
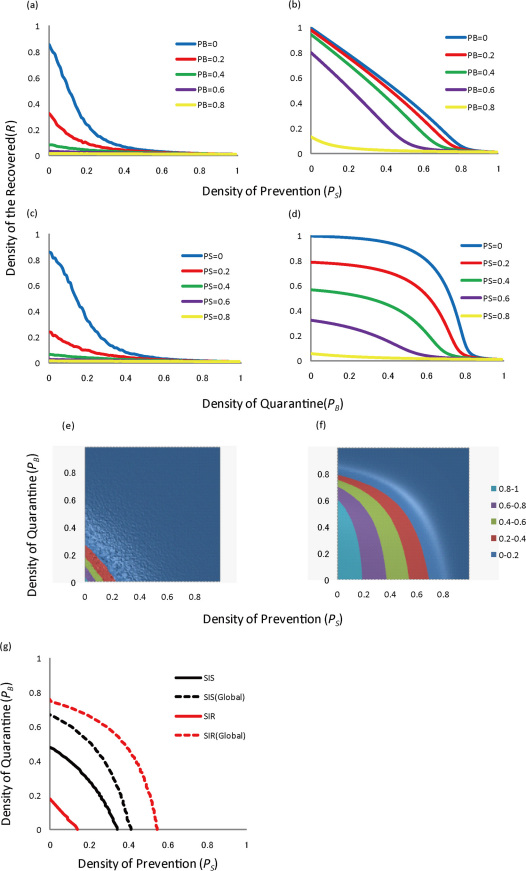
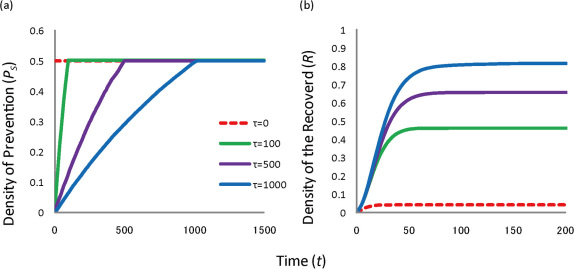
Recent breakouts of several epidemics, such as flu pandemics, are serious threats to human health. The measures of protection against these epidemics are urgent issues in epidemiological studies. Prevention and quarantine are two major approaches against disease spreads. We here investigate the combined effects of these two measures of protection using the SIR model. We use site percolation for prevention and bond percolation for quarantine applying on a lattice model. We find a strong synergistic effect of prevention and quarantine under local interactions. A slight increase in protection measures is extremely effective in the initial disease spreads. Combination of the two measures is more effective than a single protection measure. Our results suggest that the protection policy against epidemics should account for both prevention and quarantine measures simultaneously.
Figures
Similar articles
-
Modelling study suggests pandemic influenza could be controlled at source.Euro Surveill. 2005 Aug 11;10(8):E050811.4. doi: 10.2807/esw.10.32.02773-en. Euro Surveill. 2005. PMID: 16785682 No abstract available.
-
Community interventions and the epidemic prevention potential.Vaccine. 2002 Sep 10;20(27-28):3254-62. doi: 10.1016/s0264-410x(02)00316-x. Vaccine. 2002. PMID: 12213394
-
On the eradicability of infections with partially protective vaccination in models with backward bifurcation.Math Biosci Eng. 2009 Apr;6(2):395-407. doi: 10.3934/mbe.2009.6.395. Math Biosci Eng. 2009. PMID: 19364159
-
[Zoonotic infections in humans. Review of the epidemiological situation in Germany].Bundesgesundheitsblatt Gesundheitsforschung Gesundheitsschutz. 2004 Jul;47(7):622-32. doi: 10.1007/s00103-004-0867-7. Bundesgesundheitsblatt Gesundheitsforschung Gesundheitsschutz. 2004. PMID: 15254817 Free PMC article. Review. German.
-
Trends of major disease outbreaks in the African region, 2003-2007.East Afr J Public Health. 2010 Mar;7(1):20-9. doi: 10.4314/eajph.v7i1.64672. East Afr J Public Health. 2010. PMID: 21413568 Review.
Cited by
-
An epidemiological model with voluntary quarantine strategies governed by evolutionary game dynamics.Chaos Solitons Fractals. 2021 Feb;143:110616. doi: 10.1016/j.chaos.2020.110616. Epub 2021 Jan 7. Chaos Solitons Fractals. 2021. PMID: 33867699 Free PMC article.
-
Novel coronavirus, poor quarantine, and the risk of pandemic.J Hosp Infect. 2020 Apr;104(4):449-450. doi: 10.1016/j.jhin.2020.02.002. Epub 2020 Feb 11. J Hosp Infect. 2020. PMID: 32057788 Free PMC article. No abstract available.
-
Propagation Analysis of COVID-19: An SIR Model-Based Investigation of the Pandemic.Arab J Sci Eng. 2021 Aug 10:1-13. doi: 10.1007/s13369-021-05904-0. Online ahead of print. Arab J Sci Eng. 2021. PMID: 34395158 Free PMC article.
-
Emergence of protective behaviour under different risk perceptions to disease spreading.Philos Trans A Math Phys Eng Sci. 2022 Jul 11;380(2227):20200412. doi: 10.1098/rsta.2020.0412. Epub 2022 May 23. Philos Trans A Math Phys Eng Sci. 2022. PMID: 35599564 Free PMC article.
-
Suppressing the impact of the COVID-19 pandemic using controlled testing and isolation.Sci Rep. 2021 Mar 18;11(1):6279. doi: 10.1038/s41598-021-85458-1. Sci Rep. 2021. PMID: 33737580 Free PMC article.
References
-
- Anderson R.M. & May R.M. Infectious Diseases of Humans: Dynamics and Control (Oxford Univ. Press, 1991).
-
- Nowak M.A. & May R.M. Virus Dynamics (Oxford Univ. Press, 2000).
-
- Hethcote H.W. The mathematics of infectious diseases. SIAM Review 42, 599–653 (2000).
-
- Choisy M. & Guégan J.F. & Rohani P. 2006. Resonance effects and the dynamics of infectious diseases. Physica D 223, 26–35 (2006).
Publication types
MeSH terms
LinkOut - more resources
Full Text Sources
Medical
