. 2011:1:13.
doi: 10.1038/srep00013. Epub 2011 Jun 14.

Phylogenomic evidence for a common ancestor of mitochondria and the SAR11 clade

Affiliations

Phylogenomic evidence for a common ancestor of mitochondria and the SAR11 clade

J Cameron Thrash et al. Sci Rep. 2011.

Abstract

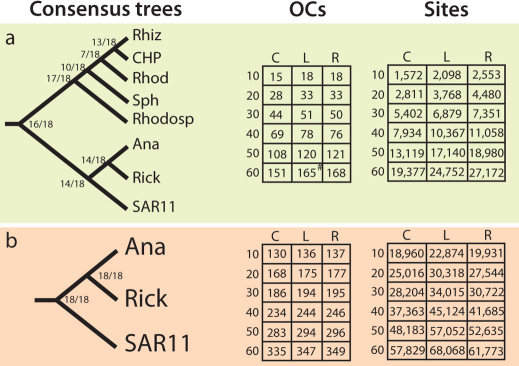
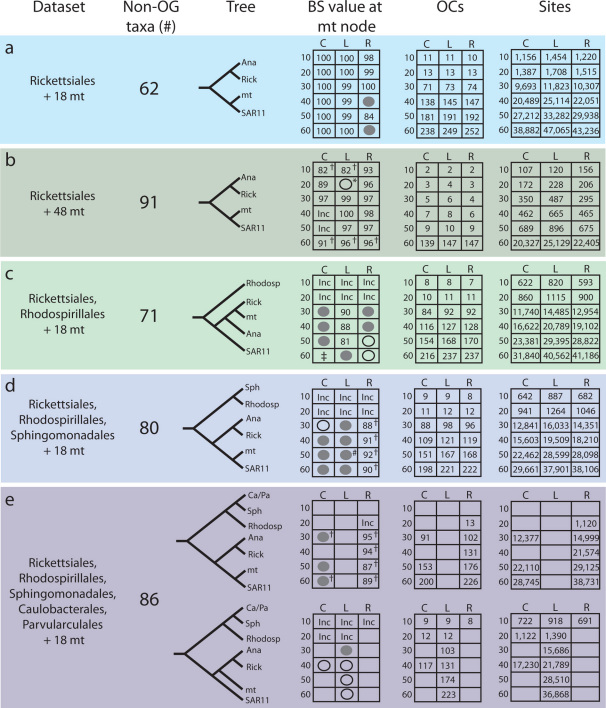
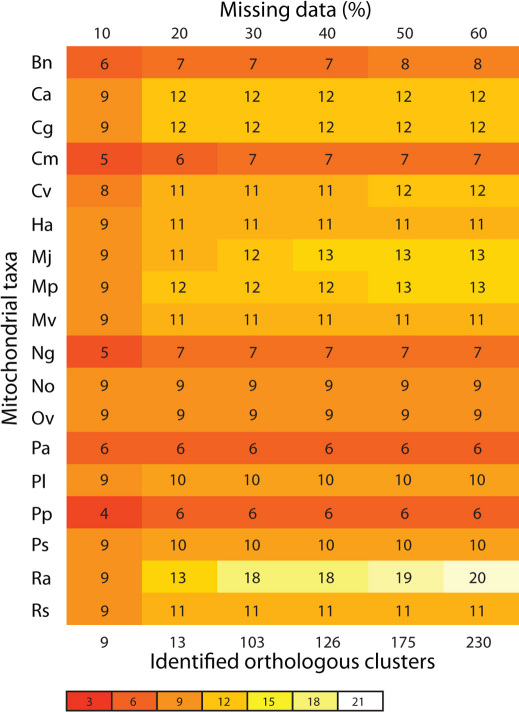
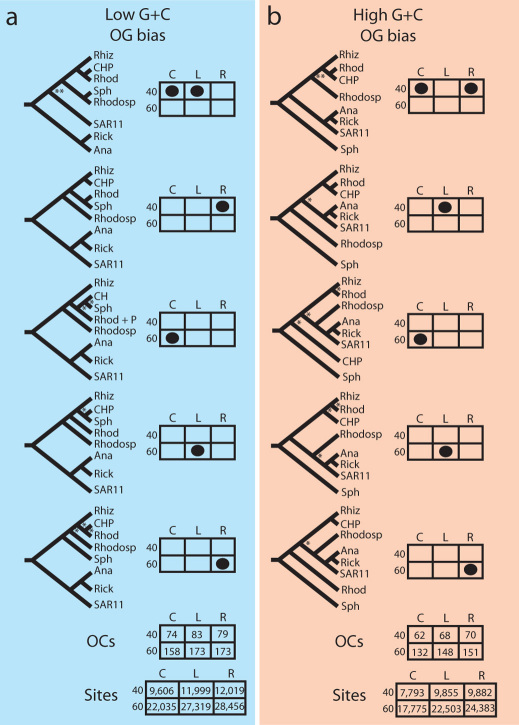
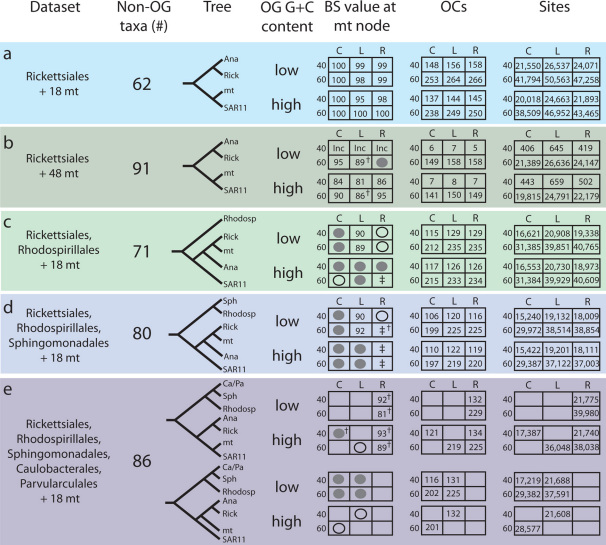
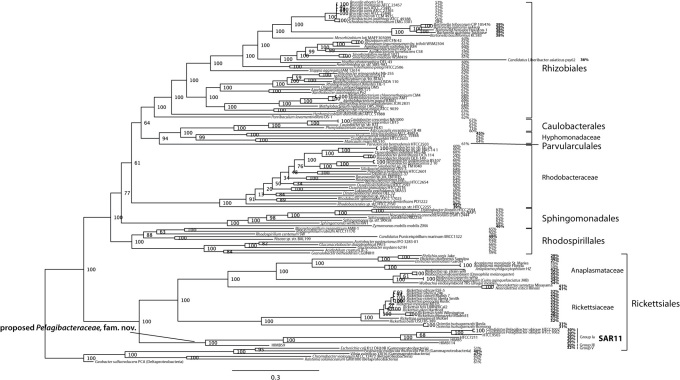
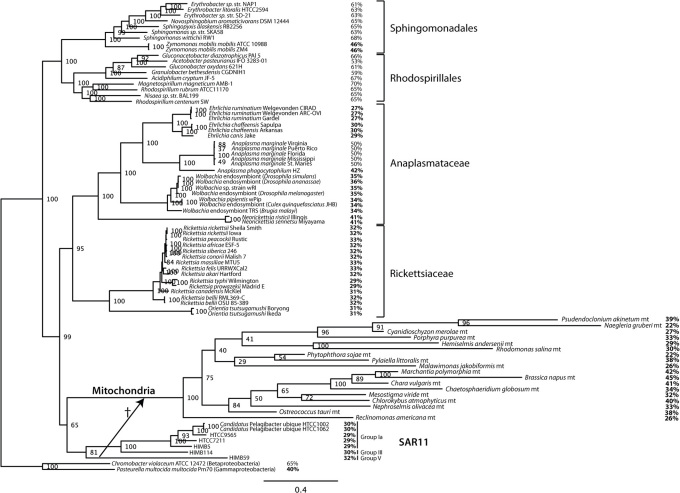
Mitochondria share a common ancestor with the Alphaproteobacteria, but determining their precise origins is challenging due to inherent difficulties in phylogenetically reconstructing ancient evolutionary events. Nonetheless, phylogenetic accuracy improves with more refined tools and expanded taxon sampling. We investigated mitochondrial origins with the benefit of new, deeply branching genome sequences from the ancient and prolific SAR11 clade of Alphaproteobacteria and publicly available alphaproteobacterial and mitochondrial genome sequences. Using the automated phylogenomic pipeline Hal, we systematically studied the effect of taxon sampling and missing data to accommodate small mitochondrial genomes. The evidence supports a common origin of mitochondria and SAR11 as a sister group to the Rickettsiales. The simplest explanation of these data is that mitochondria evolved from a planktonic marine alphaproteobacterial lineage that participated in multiple inter-specific cell colonization events, in some cases yielding parasitic relationships, but in at least one case producing a symbiosis that characterizes modern eukaryotic life.


Conflict of interest statement

All tree files, super alignments, and model files used in the study are available at: http://sar11-phylogenomics.cgrb.oregonstate.edu.

Figures

Figure 1
Figure 1. Summary of phylogenomic analyses without mitochondrial sequences.
The consensus trees for both the Alphaproteobacteria (a), and the Rickettsiales (b) across 10–60% allowed missing data are shown with concomitant information regarding number of OCs and amino acid sites for each individual tree. Rows are allowed missing data (10–60%), columns are gap-removal strategy (C- conservative, L- liberal, R- remgaps). Branching frequencies are noted at the nodes. # - this tree is featured in Fig. 6. Other abbreviations: Ana- Anaplasmataceae, Rick- Rickettsiaceae, Rhodosp- Rhodospirillales, Sph- Sphingomonadales, CHP- Caulobacterales + Hyphomonadaceae + Parvularculales, Rhod- Rhodobacteraceae.
Figure 2
Figure 2. Summary of phylogenomic analyses including mitochondrial sequences.
Data is divided by each dataset and corresponding tree topology (a–e). Internal tables for each dataset show the relevant information for each individual tree output. Rows are allowed missing data (10–60%), columns are gap-removal strategy (C- conservative, L- liberal, R- remgaps). Bootstrap support values ≥ 80% are reported, grey circles indicate a value between 79 and 51%, open circles ≤ 50%, Inc- incongruence in non-mitochondrial branch order compared with trees built without mitochondrial sequences and other studies. † - HIMB59 grouped with the mitochondria. * - two mitochondrial sequences grouped with the Ehrlichia. ‡ - mitochondria grouped with the SAR11 clade. # - this tree is featured in Fig. 7. Other abbreviations: mt- mitochondria, Ana- Anaplasmataceae, Rick- Rickettsiaceae, Rhodosp- Rhodospirillales, Sph- Sphingomonadales, Ca- Caulobacterales, Pa- Parvularculales, OG- outgroup, BS- bootstrap, OCs- orthologous clusters.
Figure 3
Figure 3. Mitochondrial OCs identified in the 18 mitochondria phylogeny alignments as a function of included missing data and total identified OCs for the liberal gap-removal trees in Fig. 2d.
Key: Bn, Brassica napus mt; Ca, Chlorokybus atmophyticus mt; Cg, Chaetosphaeridium globosum mt; Cm, Cyanidioschyzon merolae mt; Cv, Chara vulgaris mt; Ha, Hemiselmis andersenii mt; Mj, Malawimonas jakobiformis mt; Mp, Marchantia polymorpha mt; Mv, Mesostigma viride mt; Ng, Naegleria gruberi mt; No, Nephroselmis olivacea mt; Ov, Ostreococcus tauri mt; Pa, Pseudendoclonium akinetum mt; Pl, Pylaiella littoralis mt; Pp, Porphyra purpurea mt; Ps, Phytophthora soja mt; Ra, Reclinomonas americana mt; Rs, Rhodomonas salina mt.
Figure 4
Figure 4. Alphaproteobacteria tree topologies determined with outgroups biased by low (a) and high (b) G+C content.
Each observed tree is shown with an associated table for the corresponding missing data percentage(s) (rows) and gap-removal parameter(s) (columns: C- conservative, L- liberal, R- remgaps). Overall included orthologous clusters (OCs) and amino acid sites for each dataset are specified at the bottom. * - bootstrap support for that node < 60%. OG- outgroup, Ana- Anaplasmataceae, Rick- Rickettsiaceae, Rhodosp- Rhodospirillales, Sph- Sphingomonadales, CHP- Caulobacterales, Hyphomonadaceae, Parvularculales, Rhod- Rhodobacteraceae.
Figure 5
Figure 5. Summary of phylogenomic analyses with mitochondrial sequences using biased outgroups.
Data is divided by each dataset and corresponding tree topology (a–f). Internal tables for each dataset show the relevant information for each individual tree output, grouped according to G+C bias of the outgroup taxa. Rows are allowed missing data (40 and 60%), columns are gap-removal strategy (C- conservative, L- liberal, R- remgaps). Bootstrap support values ≥ 80% are reported, grey circles indicate a value between 79 and 51%, open circles ≤ 50%, Inc- incongruence in non-mitochondrial branch order compared with trees built without mitochondrial sequences and other studies. † - HIMB59 grouped with the mitochondria. ‡ - mitochondria grouped with the SAR11 clade. Other abbreviations: mt- mitochondria, Ana- Anaplasmataceae, Rick- Rickettsiaceae, Rhodosp- Rhodospirillales, Sph- Sphingomonadales, Ca- Caulobacterales, Pa- Parvularculales, OG- outgroup, BS- bootstrap, OCs- orthologous clusters.
Figure 6
Figure 6. Example tree of the Alphaproteobacteria using the median outgroup, 60% missing data included, liberal gap-removal.
G+C % is indicated for each taxon, numbers below 50% are in bold. Scale bar indicates 0.3 changes per position. Bootstrap values are indicated at nodes.
Figure 7
Figure 7. Example tree of mitochondrial taxa included with the Rickettsiales, Rhodospirillales, and Sphingomonadales using the median outgroup (Fig. 2d) showing all taxa, 50% missing data included, liberal gap removal.
Dagger indicates the single taxon instability of HIMB59, observed in several trees throughout the datasets in Fig. 2. G+C % is indicated for each taxon, numbers below 50% are in bold. Scale bar indicates 0.4 changes per position. Bootstrap values are indicated at nodes.

Similar articles

Cited by

References

    1. Gray M. W., Lang B. F. & Burge G. Mitochondria of Protists. Annu. Rev. Genet. 38, 477–524 (2004). - PubMed
    1. Embley T. M. & Martin W. Eukaryotic evolution, changes and challenges. Nature 440, 623–630 (2006). - PubMed
    1. Koonin E. V. The origin and early evolution of eukaryotes in the light of phylogenomics. Genome Biol. 11, 209–221 (2010). - PMC - PubMed
    1. Fitzpatrick D. A., Creevey C. J. & McInerney J. O. Genome Phylogenies Indicate a Meaningful α-Proteobacterial Phylogeny and Support a Grouping of the Mitochondria with the Rickettsiales. Mol. Biol. Evol. 23, 74–85 (2005). - PubMed
    1. Andersson S. G. E. et al. The genome sequence of Rickettsia prowazekii and the origin of mitochondria. Nature 396, 133–143 (1998). - PubMed

Publication types