. 2011:1:16.
doi: 10.1038/srep00016. Epub 2011 Jun 17.

Zic2 hypomorphic mutant mice as a schizophrenia model and ZIC2 mutations identified in schizophrenia patients

Affiliations

Zic2 hypomorphic mutant mice as a schizophrenia model and ZIC2 mutations identified in schizophrenia patients

Minoru Hatayama et al. Sci Rep. 2011.

Erratum in

  • Sci Rep.2011;1:49

Abstract

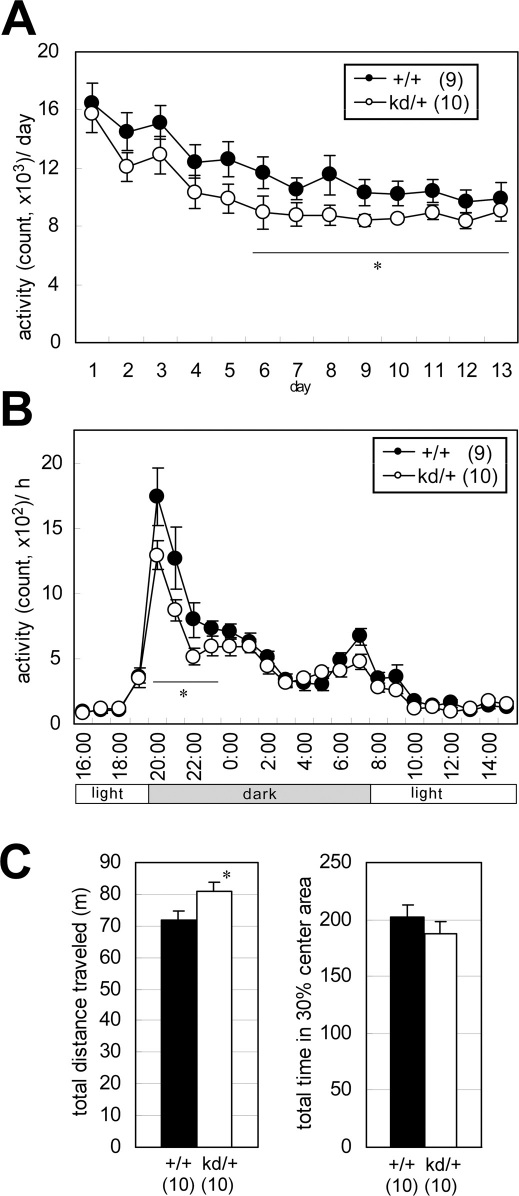
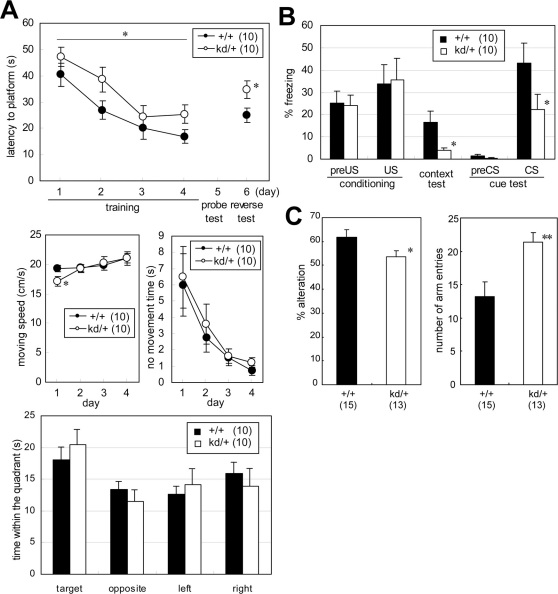
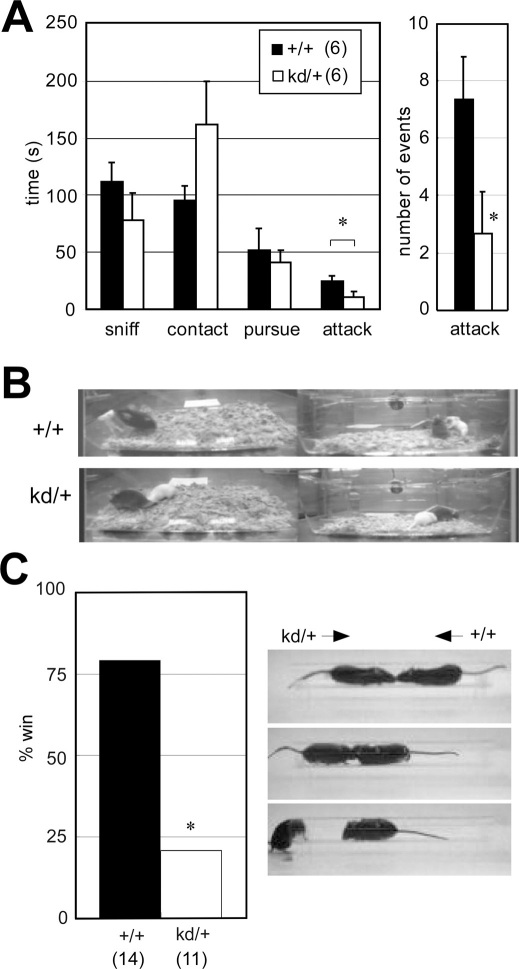
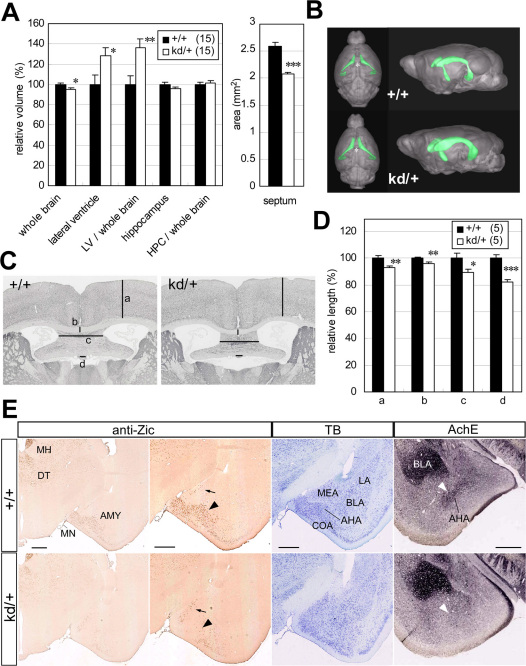
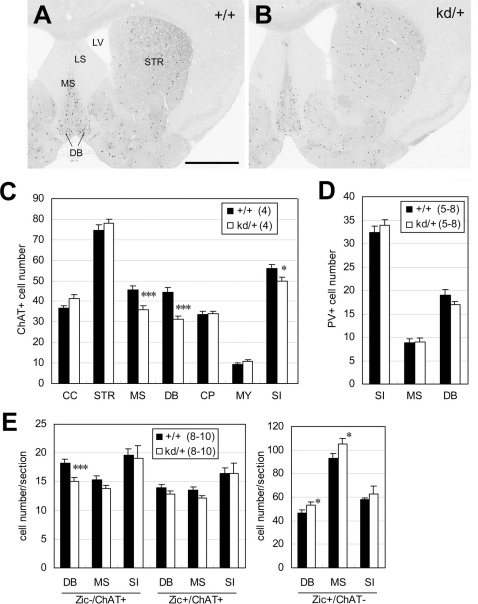
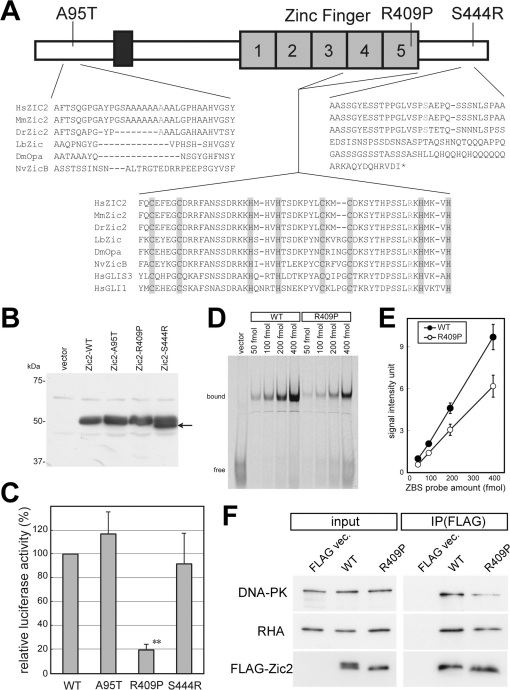
ZIC2 is a causal gene for holoprosencephaly and encodes a zinc-finger-type transcriptional regulator. We characterized Zic2(kd/+) mice with a moderate (40%) reduction in Zic2 expression. Zic2(kd/+) mice showed increased locomotor activity in novel environments, cognitive and sensorimotor gating dysfunctions, and social behavioral abnormalities. Zic2(kd/+) brain involved enlargement of the lateral ventricle, thinning of the cerebral cortex and corpus callosum, and decreased number of cholinergic neurons in the basal forebrain. Because these features are reminiscent of schizophrenia, we examined ZIC2 variant-carrying allele frequencies in schizophrenia patients and in controls in the Japanese population. Among three novel missense mutations in ZIC2, R409P was only found in schizophrenia patients, and was located in a strongly conserved position of the zinc finger domain. Mouse Zic2 with the corresponding mutation showed lowered transcription-activating capacity and had impaired target DNA-binding and co-factor-binding capacities. These results warrant further study of ZIC2 in the pathogenesis of schizophrenia.


Figures

Figure 1
Figure 1. Spontaneous motor performance abnormalities in Zic2kd/+ mice.
(A) Home cage activity was measured for 13 days. On day 1 the mice were put into a new home cage. Mean activities per day are indicated. Activity counts represent the number of time bins (approximately 0.20–0.25 s each) in which spontaneous activity including locomotor activity, rearing, and other activities such as stereotypic movements, were detected. *P < 0.05 in t-test. (B) Circadian activities. The values indicate the summation of the activities corresponding time bins (bin = 1 h) of the last 8 days (days 6–13) when the daily change in the total activity level (A) was minimal. *P < 0.05 in t-test. (C) Open field test. (left) Total distance traveled in the open box for 15 min observation period. (right) Percentage of the total time in the central area of the field (30% of the total field area). *P < 0.05 in t-test. Data is presented as means ± SEM. The number of mice in each group is given in parentheses.
Figure 2
Figure 2. Cognitive function deficits in Zic2kd/+ mice.
(A) Morris water maze test. (top) Mean latency to reach the platform during the training session (days 1–4) and reverse test session (day 6). Values indicate the mean of all six trials on the day. (middle left) Moving speed in the training session. (middle right) No movement time in the training session. (bottom) The results of the probe test (day 5) as indicated by the period of time (s) in the indicated quadrant within the 60 s testing period. *P < 0.05 in t-test. (B) Fear conditioning test. Mean percentage freezing are indicated for the conditioning test (day 1) before and after the electrical foot shock (preUS [mean of the 2 min before unconditioned-stimulus, US] and US [1 min after US] respectively), context test (day 2, mean of the total testing period [5 min]), and cue test (day 3) before and after pre tone (preCS [mean of the 2 min before conditioned stimulus, CS] and CS [mean of the 2 min with CS], respectively). *P < 0.05 in Mann-Whitney U-test. (C) Y-maze test. (left) Percentage altered selection of the entered arm. (right) Total number of arm entries. *P < 0.05 in Mann-Whitney U-test; **P < 0.01 in t-test. Data is presented as means ± SEM. The number of mice in each group is given in parentheses.
Figure 3
Figure 3. Social behavior abnormalities in Zic2kd/+ mice.
(A) Resident-intruder test. (left) Total time spent in the indicated behaviors. (right) The number of attacking events. *P < 0.05 in t-test. Data is presented as means ± SEM. (B) Captured video image of the resident-intruder test. In this case, the Zic2+/+ mouse (+/+, top, black) was attacking the white intruder mouse, whereas the Zic2kd/+ mouse (kd/+, bottom black) was moving away from the intruder mouse. The left and right images indicate the simultaneous recording from opposite directions. (C) Social dominance tube test. (left) Won rate in the total of 66 matches. The means ± SEM latencies to win were as follows: Zic2+/+, 36.5 ± 5.2; Zic2kd/+, 38.3 ± 6.4 s. (right) Captured video images from a representative match. From top to bottom, the beginning to the end of the match is sequentially indicated. In this case, the Zic2kd/+ mouse was pushed out from the plexiglass tube (30 cm) and the Zic2+/+ mouse became the winner. *P < 0.05 in chi-square test. The number of mice in each group is given in parentheses.
Figure 4
Figure 4. Morphological features of the brains from Zic2kd/+ mice.
(A) Volumetric analysis of the entire brain, lateral ventricle (LV), and hippocampus (HPC). The values for tissue volumes in Zic2kd/+mice are indicated as percentages of the corresponding wild-type values. The values for ratio of volumes in LV/whole brain and HPC/whole brain are also indicated as percentages of the corresponding wild-type values. A total of 15 pairs of Zic2+/+ and Zic2kd/+ mice were subjected to in vivo MRI imaging. *P < 0.05, **P < 0.01, ***P < 0.001 in t-test. Data is presented as means ± SEM. (B) 3D reconstruction of the outer surface of the brains of Zic2+/+ (+/+) and Zic2kd/+ (kd/+) mice (gray) with lateral ventricle (green). Dorsal (left) and anterior-lateral (right) views are indicated. Note the enlarged lateral ventricles and the narrowed interspace between the left and right lateral ventricles containing septum (asterisk). (C) Morphometric analysis. Sections were subjected to acetylcholine esterase staining. (a)–(d) Lines denote the distances measured in each section (a, cerebral cortex thickness; b, corpus callosum thickness; c, medial structure rostral to the hippocampus [fimbria including septofimbrial nucleus or septal triangular nucleus]; d, subfornical organ width). The measurements were done on 15 pairs of the most comparable from the serial sections of adult male Zic2+/+ and Zic2kd/+ mice brains. (D) Morphometric analysis. The lengths are presented as a percentage relative to the corresponding wild-type values. *P < 0.05, **P < 0.01, ***P < 0.001 in t-test. Data is presented as means ± SEM. (E) Morphological abnormalities in the amygdala. The coronal sections from Zic2+/+ (+/+) and Zic2kd/+ (kd/+) mice were subjected to immunostaining with the anti-Zic antibody, toluidine blue (TB), and acetylcholine esterase staining (AchE). The black arrowhead and arrow indicate the Zic-positive cells in the amygdalohippocampal area (AHA) and medial nucleus, respectively. The white arrowheads indicate the enhanced AchE signals in the AHA. AMY, amygdalar complex; BLA, basolateral nucleus of amygdala; COA, cortical nucleus of amygdala; DT, dorsal thalamic nuclei; LA, lateral nucleus of amygdala; MEA, medial nucleus of amygdala; MH, medial habenular nucleus; MN, meningeal membrane. Scale bars, 0.5 mm.
Figure 5
Figure 5. Decreased number of cholinergic neurons in the brains of Zic2kd/+ mice.
(A,B) Immunostaining of the brains of Zic2+/+ (+/+) (A) and Zic2kd/+ (kd/+) (B) mice with anti-ChAT antibody. Coronal sections through the septum and diagonal bands derived from adult male mice were subjected to immunoperoxidase staining. Scale bar, 1 mm. (C) Number of the ChAT+ neurons in the sections. Mean numbers of ChAT+ neurons in 20 sections from the Zic2+/+ and Zic2kd/+ mice brains are indicated. (D) PV-positive cell numbers. The measurements were taken in comparable regions to those subjected to ChAT-immunostaining. (E) The numbers of ChAT- and Zic-immunoreactive neurons in early postnatal (P5-7) Zic2+/+ and Zic2kd/+ brains. Double labeling was performed with the anti-ChAT antibody and anti-pan Zic antibody. CC, cerebral cortex; CP, caudoputamen; DB, diagonal band; LV, lateral ventricle; LS, lateral septum; MS, medial septum; MY, Mynert nucleus; SI, substantia innominata; STR, striatum. (C–E) Data is presented as means ± SEM. The number of mice in each group is given in parentheses. *P < 0.05, ***P < 0.001 in t-test.
Figure 6
Figure 6. Properties of ZIC2 variants found in schizophrenia patients.
(A) Structure of the ZIC2 protein. Gray boxes with numbers indicate C2H2 motifs in the zinc finger domain of ZIC2. The positions of the A95T, R409P, and S444R mutations are indicated. Multiple alignments of the flanking regions of three mutations are indicated along with the reference sequences. Shaded characters show conserved cysteine and histidine residues in the C2H2 zinc fingers. Black box indicates an evolutionary conserved domain (ZOC, Zic-Opa-Conserved) domain. Gray characters indicate the mutated residues and the corresponding residues in other species (Hs, Homo sapiens [human]; Mm, Mus musculus [mouse]; Dr, Danio rerio [zebrafish]; Lb, Loligo breekeri [squid]; Dm, Drosophila melanogaster (fly); Nv, Nematostella vectensis [sea anemone]). (B) Immunoblotting of mouse wild-type Zic2 and Zic2 variants. NIH3T3 cells were transfected with the FLAG-tag expression plasmids. The Zic2 proteins were detected by the anti-FLAG antibody. Arrow indicates the fast migrating component in FLAG-Zic2-S444R. (C) NIH3T3 cells were transfected with a Zic2-responsive luciferase reporter vector together with a vector expressing wild-type FLAG-Zic2 (WT), or the FLAG-Zic2-A95T, -R409P, -S444R mutant proteins. All luciferase activities were normalized to the activities of the co-transfected elongation factor 1 promoter-driven Renilla luciferase. The means ± SEM of three independent experiments of three samples each are shown. (D) Gel mobility shift assay. IRD-labeled target DNAs were incubated with partially purified FLAG-Zic2-WT or FLAG-Zic2-R409P proteins expressed in 293T cells. The probes and the amount are indicated at the top. (E) Quantification of the gel shift assay result. Data are presented as means ± SEM. There were statistically significant differences between the FLAG-Zic2-WT and FLAG-Zic2-R409P-bound DNA probes at each dose (50 fmol, P < 0.001; 100 fmol, P = 0.0022; 200 fmol, P = 0.012; and 400 fmol, P = 0.0089). (F) FLAG-Zic2-WT or FLAG-Zic2-R409P expressed in 293T cells were immunoprecipitated with the anti-FLAG antibody. Proteins in the input cell lysates (input) and immunoprecipitates (IP) were analyzed by immunoblotting using anti-DNA-PK, anti-RHA, and anti-FLAG antibodies. There was a decrease in the amount of co-precipitated DNA-PK in FLAG-Zic2-R409P immunoprecipitates compared to those from FLAG-Zic2-WT, despite comparable amounts of FLAG-Zic2-R409P and FLAG-Zic2-WT.

Similar articles

Cited by

References

    1. Aruga J. et al. The mouse zic gene family. Homologues of the Drosophila pair-rule gene odd-paired.J Biol Chem 271, 1043–1047 (1996). - PubMed
    1. Nagai T. et al. The expression of the mouse Zic1, Zic2, and Zic3 gene suggests an essential role for Zic genes in body pattern formation. Dev Biol 182, 299–313 (1997). - PubMed
    1. Aruga J. The role of Zic genes in neural development. Mol Cell Neurosci 26, 205–221 (2004). - PubMed
    1. Grinberg I. & Millen K. J. The ZIC gene family in development and disease. Clin Genet 67, 290–296, 10.1111/j.1399-0004.2005.00418.x (2005). - PubMed
    1. Merzdorf C. S. Emerging roles for zic genes in early development. Dev Dyn 236, 922–940 (2007). - PubMed

Publication types

MeSH terms