. 2011:1:21.
doi: 10.1038/srep00021. Epub 2011 Jun 23.

Locations of marine animals revealed by carbon isotopes

Affiliations

Locations of marine animals revealed by carbon isotopes

Kirsteen M MacKenzie et al. Sci Rep. 2011.

Abstract

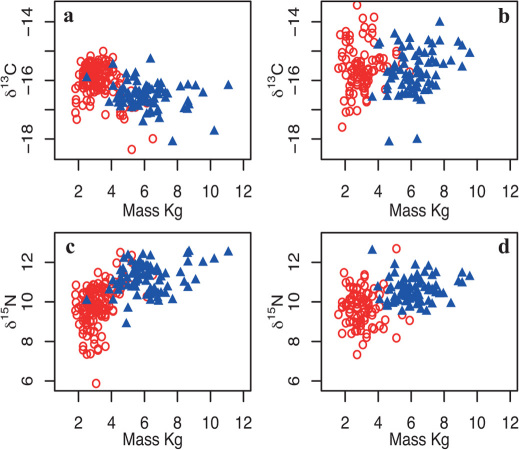
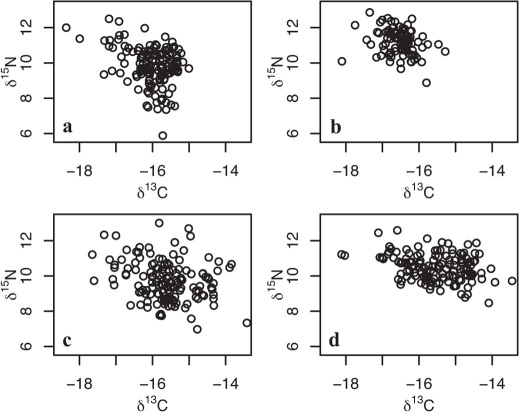
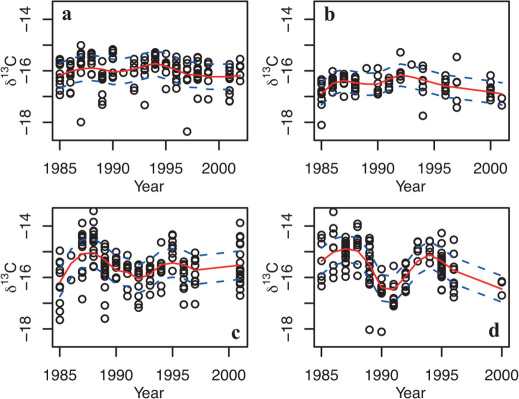
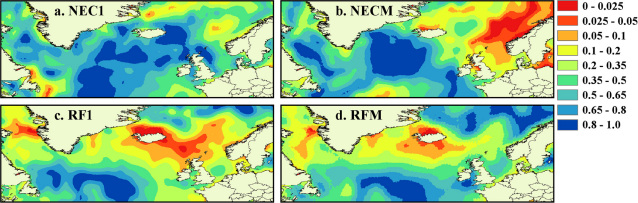
Knowing the distribution of marine animals is central to understanding climatic and other environmental influences on population ecology. This information has proven difficult to gain through capture-based methods biased by capture location. Here we show that marine location can be inferred from animal tissues. As the carbon isotope composition of animal tissues varies with sea surface temperature, marine location can be identified by matching time series of carbon isotopes measured in tissues to sea surface temperature records. Applying this technique to populations of Atlantic salmon (Salmo salar L.) produces isotopically-derived maps of oceanic feeding grounds, consistent with the current understanding of salmon migrations, that additionally reveal geographic segregation in feeding grounds between individual philopatric populations and age-classes. Carbon isotope ratios can be used to identify the location of open ocean feeding grounds for any pelagic animals for which tissue archives and matching records of sea surface temperature are available.


Figures

Figure 1
Figure 1. Relationship between fish mass and stable isotope composition in salmon returning to natal rivers either as 1SW (circle symbols) or MSW (triangle symbols) fish.
(a) River Frome δ13C values, (b) North East Coast δ13C values, (c) River Frome δ15N values, (d) North East Coast δ15N values.
Figure 2
Figure 2. Relationship between the stable isotope composition of carbon and nitrogen in salmon returning to natal rivers either as 1SW or MSW fish.
(a) River Frome 1SW, (b) River Frome MSW, (c) North East Coast 1SW, (d) North East Coast ΜSW. Despite the large spread in δ15N values, there is no positive covariance between δ13C and δ15N values, indicating limited effects of trophic level on δ13C values.
Figure 3
Figure 3. Temporal trends in δ13C values (‰) in salmon scale collagen.
(a) River Frome 1SW, (b) River Frome MSW, (c) North East Coast 1SW, (d) North East Coast ΜSW. Temporal scale represents the last year of marine feeding. Solid (red) line is a first-order LOESS fit with a span width of 0.5; dashed (blue) lines show +/− standard error of the residuals of the smoothed fit.
Figure 4
Figure 4. Proposed feeding areas for two Atlantic salmon populations indicated by the strength of correlation between temporal records of sea surface temperature and scale collagen δ13C values.
Eight month summer SST (March to October) records were extracted from the HADISST dataset at the native one-degree grid square resolution between 45–75°N latitude and 65°W–20°E longitude for the period 1985 to 2002. Yearly median summer temperatures were calculated for each degree square throughout the period studied. Correlations are based on LOESS fits to temporal data (span = 0.5). Colours indicate the significance of the correlation (p value) after adjustment of effective degrees of freedom to account for autocorrelation in both time series. Each map represents feeding areas for a specific population and cohort: (a) North East Coast 1SW, (b) North East Coast MSW, (c) River Frome 1SW, (d) River Frome MSW.

Similar articles

Cited by

References

    1. Pauly D., Christensen V., Dalsgaard J., Froese R. & Torres F. Fishing down marine food webs. Science 279, 860–863 (1998). - PubMed
    1. Myers R. A. & Worm B. Rapid worldwide depletion of predatory fish communities. Nature 423, 280–283 (2003). - PubMed
    1. Begg G. A. Friedland K. D. & Pearce J. B. Stock identification and its role in stock assessment and fisheries management: an overview. Fish. Res. 43, 1–8 (1999).
    1. Hunter E., Metcalfe J. D. & Reynolds J. D. Migration route and spawning area fidelity by North Sea plaice. Proc. R. Soc. B, 270, 2097–2103 (2003). - PMC - PubMed
    1. Wright P. J., Neat F. C., Gibb F. M. & Thordarson H. Evidence for metapopulation structuring in cod from the west of Scotland and North Sea. J. Fish Biol. 69, 181–199 (2006).

Publication types

Substances