

Silicon uptake by sponges: a twist to understanding nutrient cycling on continental margins
- PMID: 22355549
- PMCID: PMC3216517
- DOI: 10.1038/srep00030
Silicon uptake by sponges: a twist to understanding nutrient cycling on continental margins
Abstract
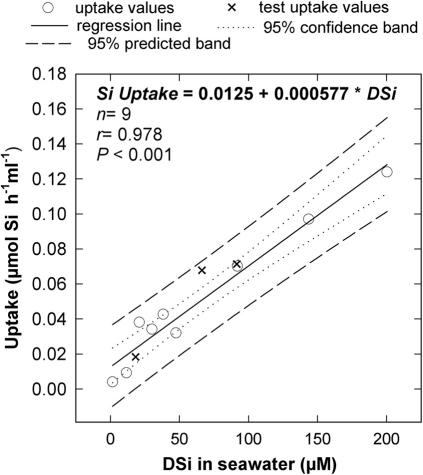
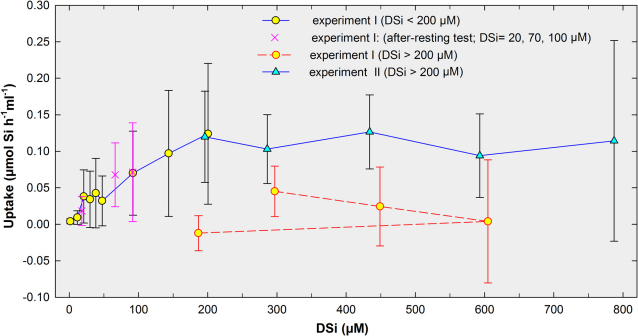
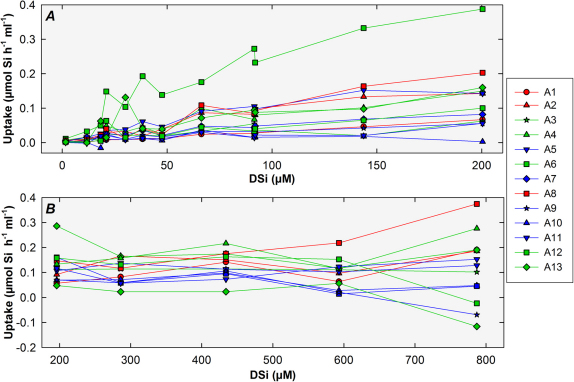
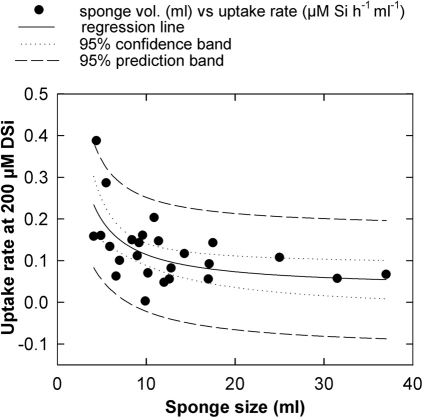
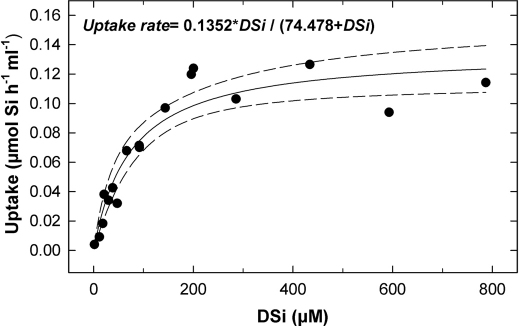
About 75% of extant sponge species use dissolved silicon (DSi) to build a siliceous skeleton. We show that silicon (Si) uptake by sublittoral Axinella demosponges follows an enzymatic kinetics. Interestingly, maximum uptake efficiency occurs at experimental DSi concentrations two orders of magnitude higher than those in the sponge habitats, being unachievable in coastal waters of modern oceans. Such uptake performance appears to be rooted in a former condition suitable to operate at the seemingly high DSi values characterizing the pre-Tertiary (>65 mya) habitats where this sponge lineage diversified. Persistence of ancestral uptake systems causes sponges to be outcompeted by the more efficient uptake of diatoms at the low ambient DSi levels characterizing Recent oceans. Yet, we show that sublittoral sponges consume substantial coastal DSi (0.01-0.90 mmol Si m(-2) day(-1)) at the expenses of the primary-production circuit. Neglect of that consumption hampers accurate understanding of Si cycling on continental margins.
Figures
Similar articles
-
In situ determination of Si, N, and P utilization by the demosponge Tethya citrina: A benthic-chamber approach.PLoS One. 2019 Jul 8;14(7):e0218787. doi: 10.1371/journal.pone.0218787. eCollection 2019. PLoS One. 2019. PMID: 31283799 Free PMC article.
-
Cooperation between passive and active silicon transporters clarifies the ecophysiology and evolution of biosilicification in sponges.Sci Adv. 2020 Jul 8;6(28):eaba9322. doi: 10.1126/sciadv.aba9322. eCollection 2020 Jul. Sci Adv. 2020. PMID: 32832609 Free PMC article.
-
Isotopic analyses of Ordovician-Silurian siliceous skeletons indicate silica-depleted Paleozoic oceans.Geobiology. 2021 Sep;19(5):460-472. doi: 10.1111/gbi.12449. Epub 2021 May 17. Geobiology. 2021. PMID: 34002455
-
Nutrient fluxes through sponges: biology, budgets, and ecological implications.Adv Mar Biol. 2012;62:113-82. doi: 10.1016/B978-0-12-394283-8.00003-5. Adv Mar Biol. 2012. PMID: 22664122 Review.
-
Biopotentials of marine sponges from China oceans: past and future.Biomol Eng. 2003 Jul;20(4-6):413-9. doi: 10.1016/s1389-0344(03)00066-2. Biomol Eng. 2003. PMID: 12919827 Review.
Cited by
-
Is the middle Cambrian Brooksella a hexactinellid sponge, trace fossil or pseudofossil?PeerJ. 2023 Feb 24;11:e14796. doi: 10.7717/peerj.14796. eCollection 2023. PeerJ. 2023. PMID: 36860767 Free PMC article.
-
Aggregated clumps of lithistid sponges: a singular, reef-like bathyal habitat with relevant paleontological connections.PLoS One. 2015 May 27;10(5):e0125378. doi: 10.1371/journal.pone.0125378. eCollection 2015. PLoS One. 2015. PMID: 26016786 Free PMC article.
-
Marine siliceous ecosystem decline led to sustained anomalous Early Triassic warmth.Nat Commun. 2022 Jun 18;13(1):3509. doi: 10.1038/s41467-022-31128-3. Nat Commun. 2022. PMID: 35717338 Free PMC article.
-
The Evolution of Silicon Transport in Eukaryotes.Mol Biol Evol. 2016 Dec;33(12):3226-3248. doi: 10.1093/molbev/msw209. Epub 2016 Oct 11. Mol Biol Evol. 2016. PMID: 27729397 Free PMC article.
-
In situ determination of Si, N, and P utilization by the demosponge Tethya citrina: A benthic-chamber approach.PLoS One. 2019 Jul 8;14(7):e0218787. doi: 10.1371/journal.pone.0218787. eCollection 2019. PLoS One. 2019. PMID: 31283799 Free PMC article.
References
-
- Nelson D. M., Tréguer P., Brzezinski M. A., Leynaert A. & Quéguiner B. Production and dissolution of biogenic silica in the ocean: revised global estimates, comparison with regional data and relationship to biogenic sedimentation. Global Biogeochem. Cycles 9, 359–372 (1995).
-
- Ragueneau O. et al. A review of the Si cycle in the modern ocean: recent progress and missing gaps in the application of biogenic opal as paleoproductivity proxy. Global Planet. Change 26, 317–365 (2000).
-
- Sarmiento J. & Gruber N. Ocean biogeochemical dynamics. (Princeton University Press, 2006).
-
- Siever R. in Scientists on Gaia eds S. H. Scheneider & P. J. Boston) 287–295 (MIT Press, 1991).
-
- Harrison K. G. The role of increased marine silica input on paleo-pCO2 levels. Paleoceanography 15, 292–298 (2000).
Publication types
MeSH terms
Substances
LinkOut - more resources
Full Text Sources
