. 2011:1:35.
doi: 10.1038/srep00035. Epub 2011 Jul 13.

Structural hierarchies define toughness and defect-tolerance despite simple and mechanically inferior brittle building blocks

Affiliations

Structural hierarchies define toughness and defect-tolerance despite simple and mechanically inferior brittle building blocks

Dipanjan Sen et al. Sci Rep. 2011.

Abstract

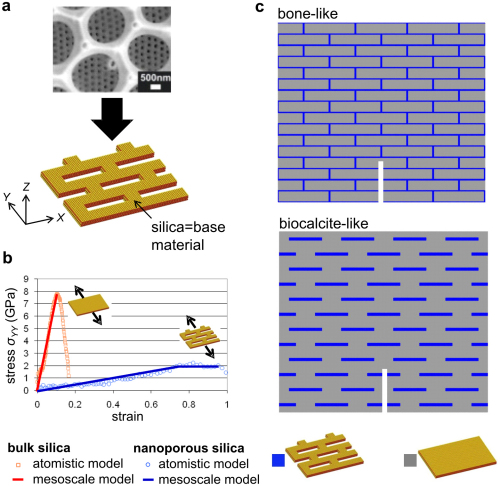
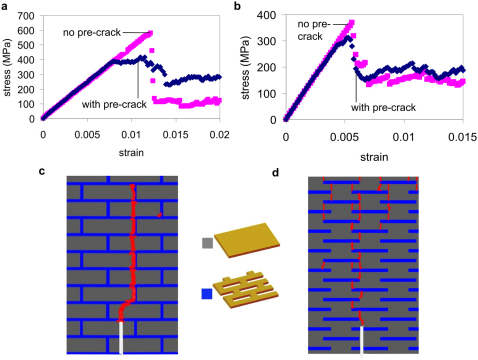
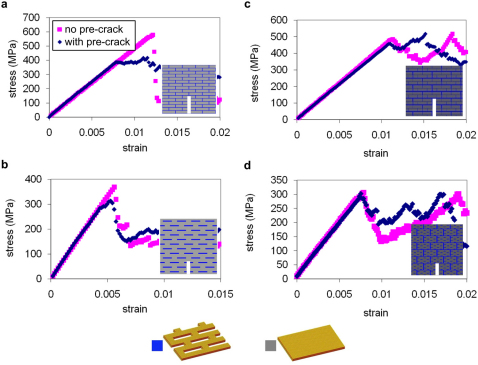
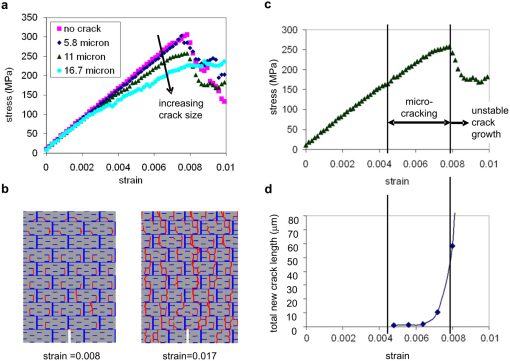
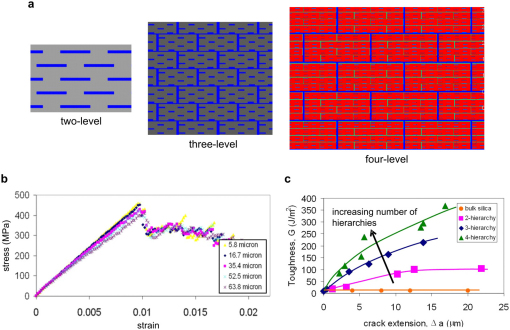
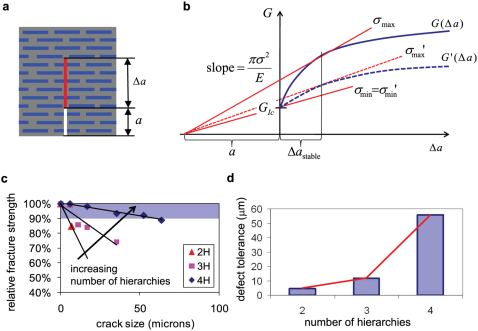
Mineralized biological materials such as bone, sea sponges or diatoms provide load-bearing and armor functions and universally feature structural hierarchies from nano to macro. Here we report a systematic investigation of the effect of hierarchical structures on toughness and defect-tolerance based on a single and mechanically inferior brittle base material, silica, using a bottom-up approach rooted in atomistic modeling. Our analysis reveals drastic changes in the material crack-propagation resistance (R-curve) solely due to the introduction of hierarchical structures that also result in a vastly increased toughness and defect-tolerance, enabling stable crack propagation over an extensive range of crack sizes. Over a range of up to four hierarchy levels, we find an exponential increase in the defect-tolerance approaching hundred micrometers without introducing additional mechanisms or materials. This presents a significant departure from the defect-tolerance of the base material, silica, which is brittle and highly sensitive even to extremely small nanometer-scale defects.


Figures

Figure 1
Figure 1. Structure and properties of nanoporous silica inspired from the nanostructure of diatom algae, and two commonly occurring periodic motifs chosen for the nanoporous silica/bulk silica composites.
a, Scanning Electron Microscope (SEM) image of a diatom nanostructure (image reprinted with permission from Ref. 49) and full-atomistic model of α-quartz nanoporous silica, stress-strain response obtained from atomistic simulations of tensile loading of the nanoporous silica and bulk silica. b, Mesoscale model stress-strain response. The base material for both structures is silica and identical for both structures but the different organization leads to a drastically changed mechanical response (the stress-strain data shown is averaged over a representative cell in each case). c, Representation of two biological structures, bone-like and biocalcite-like. The upper structure (bone-like) represents one in which the soft/tough nanoporous silica material is the matrix phase in which hard/brittle bulk silica platelets are dispersed. In the lower structure (biocalcite-like) the hard/brittle bulk silica material serves as the matrix material in which soft/tough nanoporous silica platelets are dispersed. These structures mimic those seen in bone and nacre biological calcite single crystals, respectively.
Figure 2
Figure 2. Characteristic stress-strain curves with and without a crack for two geometries and associated crack propagation paths (initial crack: white line, crack path: red line).
a, Bone-like composite structures, with and without presence of a pre-crack (pre-crack length 5.4 μm). The fracture strength changes drastically upon the introduction of a crack. b, Stress-strain curves for a biocalcite-like composite structure, with and without presence of a pre-crack (pre-crack length 6.96 μm). The sensitivity to fracture strength is much smaller than for the bone-like composite, although the magnitude of the fracture strength is lower. c and d, Crack pathways (marked in red) for bone-like and biocalcite-like hierarchical structures in the presence of a pre-crack. c, The image shows that for bone-like structures, the pre-crack propagates through the sample, but the structure is toughened by the platelets bridging the wake of the crack as it propagates. d, For small crack sizes failure in the biocalcite-like structure propagates through the nucleation of several micro-cracks at nanoporous silica/bulk-silica interfaces located far from the original crack tip. The fracture strength is reached when several of these micro-cracks link up along with the pre-crack to create a complete failure path through the sample. These results show that different crack propagation paths in the two structures lead to different defect-tolerance responses.
Figure 3
Figure 3. Comparison of the stress-strain response of two-hierarchy (a, b) and three-hierarchy (c, d) materials, considering both self-similar (a, c) and dissimilar (c, d) designs.
a, Stress-strain curves for the two-hierarchy bone-like composite structures, with and without presence of a pre-crack (pre-crack length 5.8 μm). b, Stress-strain curves for two-hierarchy biocalcite-like composite structures, with and without presence of a pre-crack (pre-crack length 6.96 μm). c, Three-hierarchy self-similar structure made of bone-like composite structure at both the second and third levels, with and without presence of a pre-crack (pre-crack length 4.8 μm). The data shows that the sensitivity of fracture strength vs. crack size is much smaller for the three-hierarchy material. d, Three-hierarchy dissimilar structure made of biocalcite-like composite structure at the second level and bone-like at the third level, with and without presence of a pre-crack (pre-crack length 5.8 μm). Similar as for the case presented in panel c, the sensitivity of fracture strength vs. crack size is smaller for the three-hierarchy material than for the two-hierarchy case.
Figure 4
Figure 4. Detailed analysis of the source of defect tolerance in three-hierarchy structures.
a, Stress-strain behavior and fracture strengths for several samples of the dissimilar three-hierarchy structure with different crack sizes. We find that with a 300% increase in crack size from 6 μm to 18 μm there is only a 24% drop in fracture strength. b and c, The latter part of the rising stress regime before fracture occurs involves the opening of many micro-cracks throughout the sample (crack size 11 μm). These micro-cracks are shown in red color in panel b, with the numbers indicating applied strain values. Once these microcracks start moving and link up to the pre-crack, there is unstable crack-propagation leading to a drop in stress and thus, the fracture strength. Panel d shows that this effect can also be measured through the total new surface area created during the diffuse micro-cracking regime, during which time the main crack remains stationary. Data shown in panels b–c for the case of a pre-crack length of 11 μm.
Figure 5
Figure 5. Geometry of the four-hierarchy level material, stress-strain plots, and R-curve behavior.
a, Geometry of two-hierarchy, three-hierarchy and four-hierarchy structures for comparison, with the four-hierarchy structure having a second hierarchical level that is biocalcite-like, while the third and fourth levels are bone-like. In the four-hierarchy structure, the color scheme is: bulk silica–red, nanoporous silica–green and blue, to show the four levels more clearly. The overall volume fraction of the bulk-silica constituent is kept constant at 80% in all cases. b, Stress-strain curves for the four-hierarchy structure with various crack sizes from ≈6 μm to ≈64 μm. Almost no change in fracture strength is seen over this very large change in crack size for the four-level hierarchy material. This directly shows that the defect-tolerance has increased substantially over two-hierarchy and three-hierarchy structures. c, R-curve behavior of bulk silica and for two, three, and four levels of hierarchy structures (for initial crack sizes of 6.96 μm, 6.96 μm, 16.7 μm, and 63.8 μm, respectively). The R-curve measures changes in fracture toughness as a crack propagates through the change in energy released per unit length of stable crack advance.
Figure 6
Figure 6. Relation between the R-curve, rate of fracture strength change with crack size, and the defect-tolerance length scale for varied number of hierarchies.
a, Definition of variables a (initial crack length) and Δa (crack advance length). b, Schematic of R-curve Ga) in a material with a rising R-curve resistance and link to unstable crack propagation. The rising R-curve shown here resembles those seen in hierarchical structures (e.g.: Fig. 5a). The load at which a crack with a certain size will propagate unstably and thus cause catastrophic failure can be calculated by marking off the crack size on the negative-X axis and constructing the tangent to the R-curve passing through this point. The slope of this curve is proportional to the load or fracture stress at which this crack propagates unstably. For comparison the plot also shows a second R-curve (G'(Δa)) that does not rise as rapidly, resembling those R-curves seen in Fig. 5a for fewer levels of hierarchies. The fracture stress at which the crack propagates unstably is much smaller, indicating a smaller defect tolerance. b, Fracture stress as a percentage loss from the strength of structures with no cracks, measured for two-, three- , and four-hierarchy structures and for varied crack sizes. The shaded region shows the crack sizes with less than 10% loss in strength. The data shows that the sensitivity of the fracture strength to crack size decreases substantially with increasing hierarchy level. c, Plot of the defect-tolerant length scale over the number of hierarchies. The defect-tolerant length-scale reaches ≈60 μm with four levels of hierarchy. The red line represents an exponential fit of L = 1.17 exp(1.255N), where L is the defect-tolerant length scale in micrometers, and N is the number of hierarchy levels. The limiting value of one level of hierarchy, i.e., bulk silica, features a vanishing defect-tolerant response on the order of nanometers.

Similar articles

Cited by

References

    1. Rho J. Y., Kuhn-Spearing L. & Zioupos P. Mechanical properties and the hierarchical structure of bone. Medical Engineering & Physics 20, 92–102 (1998). - PubMed
    1. Sarikaya M. An introduction to biomimetics: A structural viewpoint. Microscopy research and technique 27, 360–375 (1994). - PubMed
    1. Aizenberg J. et al. Skeleton of Euplectella sp.: Structural hierarchy from the nanoscale to the macroscale. Science 309, 275–278 (2005). - PubMed
    1. Losic D., Pillar R. J., Dilger T., Mitchell J. G. & Voelcker N. H. Atomic force microscopy (AFM) characterisation of the porous silica nanostructure of two centric diatoms. Journal of Porous Materials 14, 61–69 (2007).
    1. Thiel B. L., Guess K. B. & Viney C. Non-periodic lattice crystals in the hierarchical microstructure of spider (major ampullate) silk. Biopolymers 41, 703–719 (1997). - PubMed

Publication types