. 2011:1:50.
doi: 10.1038/srep00050. Epub 2011 Jul 29.

Population diversity and function of hyperpolarization-activated current in olfactory bulb mitral cells

Affiliations

Population diversity and function of hyperpolarization-activated current in olfactory bulb mitral cells

Kamilla Angelo et al. Sci Rep. 2011.

Abstract

Although neurons are known to exhibit a broad array of intrinsic properties that impact critically on the computations they perform, very few studies have quantified such biophysical diversity and its functional consequences. Using in vivo and in vitro whole-cell recordings here we show that mitral cells are extremely heterogeneous in their expression of a rebound depolarization (sag) at hyperpolarized potentials that is mediated by a ZD7288-sensitive current with properties typical of hyperpolarization-activated cyclic nucleotide gated (HCN) channels. The variability in sag expression reflects a functionally diverse population of mitral cells. For example, those cells with large amplitude sag exhibit more membrane noise, a lower rheobase and fire action potentials more regularly than cells where sag is absent. Thus, cell-to-cell variability in sag potential amplitude reflects diversity in the integrative properties of mitral cells that ensures a broad dynamic range for odor representation across these principal neurons.


Figures

Figure 1
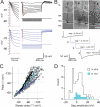
Figure 1. Variability of hyperpolarization-evoked sag potentials recorded in vivo.
A1 Example of hyperpolarization-induced sag potentials recorded from a mitral cell on the dorsal surface of the rat olfactory bulb (average of 20 sweeps for each hyperpolarizing current injection step). A2 Plot of the peak (*) vs. the steady state (**) shows the voltage-dependency and variability of sag amplitude (n = 13).
Figure 2
Figure 2. Variability of hyperpolarization-evoked sag potentials recorded in vitro.
A Voltage responses to hyperpolarizing current injections in a sag expressing (black) and a no-sag expressing cell (blue). Dashed red boxes show the region of the traces that has been magnified on the left to show the exponential time course of the charging of the membrane at the beginning of the current injection. The sag cell was injected with a maximum of −300 pA decreasing by −50 pA for every sweep. The no sag cell was injected with a maximum of −1777 pA decreasing in steps of −355 pA. B Example of the sag amplitude variability across mitral cells (GL = glomerular layer, EPL = external plexiform layer, MCL = mitral cell layer, GCL = granule cell layer. Scale bar is 100 µm). C Peak vs. steady state voltage showing the voltage-dependency of the sag and its variable amplitude between cells (n = 83). The sag (black) and no sag (blue) examples are the cells shown in A. D Distribution of sag expressing cells recorded both in vitro and in vivo.
Figure 3
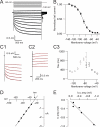
Figure 3. Characterization of a hyperpolarization-evoked current.
A In the presence of synaptic and ion channel blockers (see methods) the cell was voltage-clamped at −50 mV and held between −50 and −140 mV in steps 10 mV for 2 seconds. Subsequently ZD7288 was applied, thus the traces examples are the ZD7288 sensitive current exclusively. B Activation curve of the tail current (measured at arrow in A) obtained from recordings as in A. Sigmoid fitting indicates half maximal activation at V½ = −88 ± 2, n = 7. The activation (C1) and deactivation (C2) times were determined by single exponential fitting (red). C3 Pooled data showing activation (grey) and deactivation (black) time constants (n = 7). D The reversal potential of Ih was determined to −32 ± 2 mV (n = 7) by linear extrapolation to the peak of the tail current from clamping at potentials between −85 and −35 mV after full activation of the current for 2 seconds. E Plot showing the correlation between the voltage-sensitive Ih and the instantaneous (Iinst) current (r > 0.9, n = 5).
Figure 4
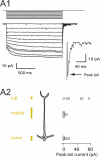
Figure 4. Distribution of Ih current along the soma -apical dendritic axis.
A1 Example of the macroscopic Ih current recorded in a cell-attached patch at the branch point of the apical dendrite and the tuft. The patch potential was clamped at −60 mV and hyperpolarized in steps of 5 mV. Peak tail currents were obtained by stepping back to the holding potential after 1500 ms. A2 Peak tail currents (recorded as in A1, arrow) recorded in cell-attached patches in the soma (n = 7, soma), along the apical dendrite (n = 7, middle) and the most distal region of the apical dendrite (n = 6, tuft).
Figure 5
Figure 5. The membrane potential sag and its relation to the Ih current.
A Example membrane voltage traces highlighting the effect of ZD7288 on the sag potential. The current injection steps are −356 pA and −712 pA (mean ± S.D., sagctrl: 7.37 ± 3 mV vs. sagZD: 0.03 ± 0.12 mV, n = 12, 10 – 40 μM ZD7288, p < 0.05). Dashed red box show the regions of the control and ZD7288 traces that have been enlarged to observe the bridge test pulse. B Plot of the peak vs. the steady state voltage under control and following application of ZD7288. Block of the sag was observed for all recorded voltages (n = 4 cells). C Left: Example of the sag potential recorded in current-clamp and the current recorded in Ih isolation cocktail under voltage-clamp conditions in the same cell (at −100 mV) Right: Plot of the relation between sag amplitude and the voltage-clamp recorded Ih current in the same cell (r = −0.78, p < 0.05). The data point corresponding to the example traces is represented in the graph by the open circle.
Figure 6
Figure 6. Sag expression and the effect of ZD7288 on spike regularity.
A1 Example current-voltage relation of a sag (left) and a no sag expressing mitral cell (right). A2 Raster plots of spiking in cells shown in A1 during injection of depolarizing current up to 450 pA in steps of 50 pA. B Plot of the coefficient of variation of the mean inter-spike interval (CVISI) against current injection amplitudes ranging from 135 – 450 pA for the sag and no sag groups (mean ± S.E.M. of n = 15 sag cells; n = 17 no sag cells, p-values < 0.05 are marked with *). C Left: Example traces of spiking in a sag expressing mitral cell during a 1500 ms sustained current injection of 350 pA before (black) and after (red) ZD7288 application (left). Right: Summary of the CVISI in control and in the presence of ZD7288 (n = 8 cells).
Figure 7
Figure 7. Sag expression co-varies with other intrinsic properties.
A Left: Examples traces for a no sag and sag cell in response to the minimum current injection necessary to generate the 1st spike. Cells were held at −50 mV. Right: Summary of the difference in the rheobase between sag and no sag cells (mean ± S.E.M., sag: n = 15, no sag: n = 17, p < 0.05). B Plot of the average firing rate vs. current step amplitude in a sag (black) and no sag cell (blue). Data points fitted with sigmoid functions. C Pooled F/I curves from the sag vs. no sag cells (n = 15 for each group). D Example traces (insert) and the corresponding power spectral density of a sag (black) and no sag cell (blue) held at −50 mV for 2500 ms. E The standard deviation of the voltage fluctuation around −50 mV in recordings from sag and no sag cells (mean ± S.D.; n = 14, p < 0.05). F The sag amplitude plotted against input resistance. The data points were fitted with a straight line (black dashed, 2.6 MΩ/mV, r = 0.634, p < 0.05). Blue and black filled circles indicate the cells used for the sag and no sag groups analyzed in detail in this study. Dashed horizontal rectangles indicate four input resistance value bins that contain a relatively high number of cells that highlight a broad range of sag amplitude values.
Figure 8
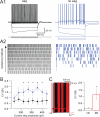
Figure 8. Sag and spike output during physiologically-relevant fluctuations in membrane potential.
A1 Mitral cell membrane potential (black trace top, only 4 cycles are shown for clarity) obtained via in vivo whole-cell recording showing nasal inhalation-coupled subthreshold oscillations. This waveform was delivered via current injection into either sag (black) or no sag (blue) cells in vitro. Bottom: example traces highlighting mitral cell responses to oscillatory current injection. A2 Raster plots obtained from spiking responses to injection of the same in vivo stimulus (total of 25 cycles) repeated five times in each of the five sag (top panels, black) and no sag cells (bottom panels, blue). Cells are ranked from 1 to 5 based on their overall firing probability (highest to lowest). Beneath each group of raster plots is a histogram showing the mean number of spikes evoked within each cycle. B Pie chart showing the fraction of cycles that failed to evoked spikes for both groups of cells. Bar graphs showing the probabilities for none, one, two, three or four or more spikes discharged per cycle.

References

    1. Magee J. C. Dendritic hyperpolarization-activated currents modify the integrative properties of hippocampal CA1 pyramidal neurons. J. Neurosci. 18, 7613–24 (1998). - PMC - PubMed
    1. Williams S. R. & Stuart G. J. Site independence of EPSP time course is mediated by dendritic I(h) in neocortical pyramidal neurons. J. Neurophysiol. 83, 3177–82 (2000). - PubMed
    1. Berger T., Larkum M. E. & Luscher H. R. High I(h) channel density in the distal apical dendrite of layer V pyramidal cells increases bidirectional attenuation of EPSPs. J. Neurophysiol. 85, 855–68 (2001). - PubMed
    1. Nolan M. F. et al.. The hyperpolarization-activated HCN1 channel is important for motor learning and neuronal integration by cerebellar Purkinje cells. Cell 115, 551–64 (2003). - PubMed
    1. Angelo K., London M., Christensen S. R. & Hausser M. Local and global effects of I(h) distribution in dendrites of mammalian neurons. J. Neurosci. 27, 8643–53 (2007). - PMC - PubMed

Publication types