

Next generation sequencing has lower sequence coverage and poorer SNP-detection capability in the regulatory regions
- PMID: 22355574
- PMCID: PMC3216542
- DOI: 10.1038/srep00055
Next generation sequencing has lower sequence coverage and poorer SNP-detection capability in the regulatory regions
Abstract
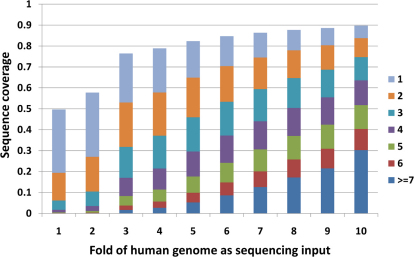
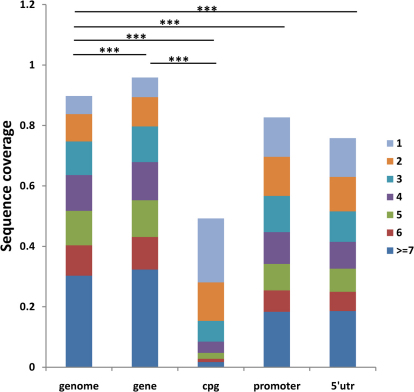
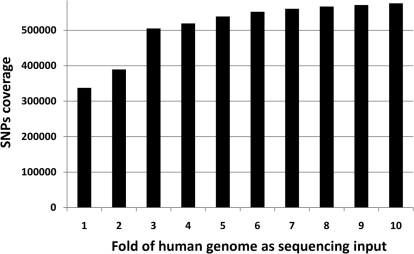
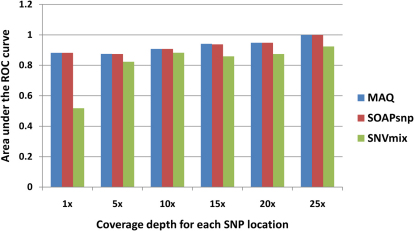
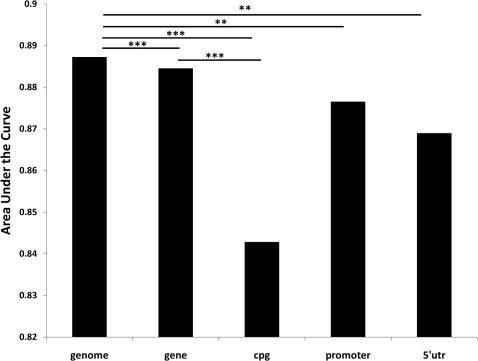
The rapid development of next generation sequencing (NGS) technology provides a new chance to extend the scale and resolution of genomic research. How to efficiently map millions of short reads to the reference genome and how to make accurate SNP calls are two major challenges in taking full advantage of NGS. In this article, we reviewed the current software tools for mapping and SNP calling, and evaluated their performance on samples from The Cancer Genome Atlas (TCGA) project. We found that BWA and Bowtie are better than the other alignment tools in comprehensive performance for Illumina platform, while NovoalignCS showed the best overall performance for SOLiD. Furthermore, we showed that next-generation sequencing platform has significantly lower coverage and poorer SNP-calling performance in the CpG islands, promoter and 5'-UTR regions of the genome. NGS experiments targeting for these regions should have higher sequencing depth than the normal genomic region.
Figures
Similar articles
-
inGAP: an integrated next-generation genome analysis pipeline.Bioinformatics. 2010 Jan 1;26(1):127-9. doi: 10.1093/bioinformatics/btp615. Epub 2009 Oct 30. Bioinformatics. 2010. PMID: 19880367 Free PMC article.
-
Coverage-based consensus calling (CbCC) of short sequence reads and comparison of CbCC results to identify SNPs in chickpea (Cicer arietinum; Fabaceae), a crop species without a reference genome.Am J Bot. 2012 Feb;99(2):186-92. doi: 10.3732/ajb.1100419. Epub 2012 Feb 1. Am J Bot. 2012. PMID: 22301893
-
SNVHMM: predicting single nucleotide variants from next generation sequencing.BMC Bioinformatics. 2013 Jul 15;14:225. doi: 10.1186/1471-2105-14-225. BMC Bioinformatics. 2013. PMID: 23855743 Free PMC article.
-
Review of alignment and SNP calling algorithms for next-generation sequencing data.J Appl Genet. 2016 Feb;57(1):71-9. doi: 10.1007/s13353-015-0292-7. Epub 2015 Jun 9. J Appl Genet. 2016. PMID: 26055432 Review.
-
Genome resequencing and genetic variation.Nat Biotechnol. 2008 Jan;26(1):65-6. doi: 10.1038/nbt0108-65. Nat Biotechnol. 2008. PMID: 18183021 Review. No abstract available.
Cited by
-
Prediction accuracies for growth and wood attributes of interior spruce in space using genotyping-by-sequencing.BMC Genomics. 2015 May 9;16(1):370. doi: 10.1186/s12864-015-1597-y. BMC Genomics. 2015. PMID: 25956247 Free PMC article.
-
2011 German Escherichia coli O104:H4 outbreak: whole-genome phylogeny without alignment.BMC Res Notes. 2011 Dec 13;4:533. doi: 10.1186/1756-0500-4-533. BMC Res Notes. 2011. PMID: 22166159 Free PMC article.
-
Sequencing refractory regions in bird genomes are hotspots for accelerated protein evolution.BMC Ecol Evol. 2021 Sep 18;21(1):176. doi: 10.1186/s12862-021-01905-7. BMC Ecol Evol. 2021. PMID: 34537008 Free PMC article.
-
SNP Discovery through Next-Generation Sequencing and Its Applications.Int J Plant Genomics. 2012;2012:831460. doi: 10.1155/2012/831460. Epub 2012 Nov 22. Int J Plant Genomics. 2012. PMID: 23227038 Free PMC article.
-
The Genomic Scrapheap Challenge; Extracting Relevant Data from Unmapped Whole Genome Sequencing Reads, Including Strain Specific Genomic Segments, in Rats.PLoS One. 2016 Aug 8;11(8):e0160036. doi: 10.1371/journal.pone.0160036. eCollection 2016. PLoS One. 2016. PMID: 27501045 Free PMC article.
References
-
- Flicek P. & Birney E. Sense from sequence reads: methods for alignment and assembly (vol 6, pg S6, 2009). Nat Methods 7, 479–479 (2010). - PubMed
-
- Mardis E. R. The impact of next-generation sequencing technology on genetics. Trends Genet 24, 133–141 (2008). - PubMed
-
- Mardis E. R. Next-generation DNA sequencing methods. Annu Rev Genomics Hum Genet 9, 387–402 (2008). - PubMed
-
- Bonetta L. Genome sequencing in the fast lane. Nat Methods 3, 141–147 (2006).
Publication types
MeSH terms
Substances
LinkOut - more resources
Full Text Sources
Other Literature Sources
