

Modelling predicts that heat stress, not drought, will increase vulnerability of wheat in Europe
- PMID: 22355585
- PMCID: PMC3216553
- DOI: 10.1038/srep00066
Modelling predicts that heat stress, not drought, will increase vulnerability of wheat in Europe
Abstract
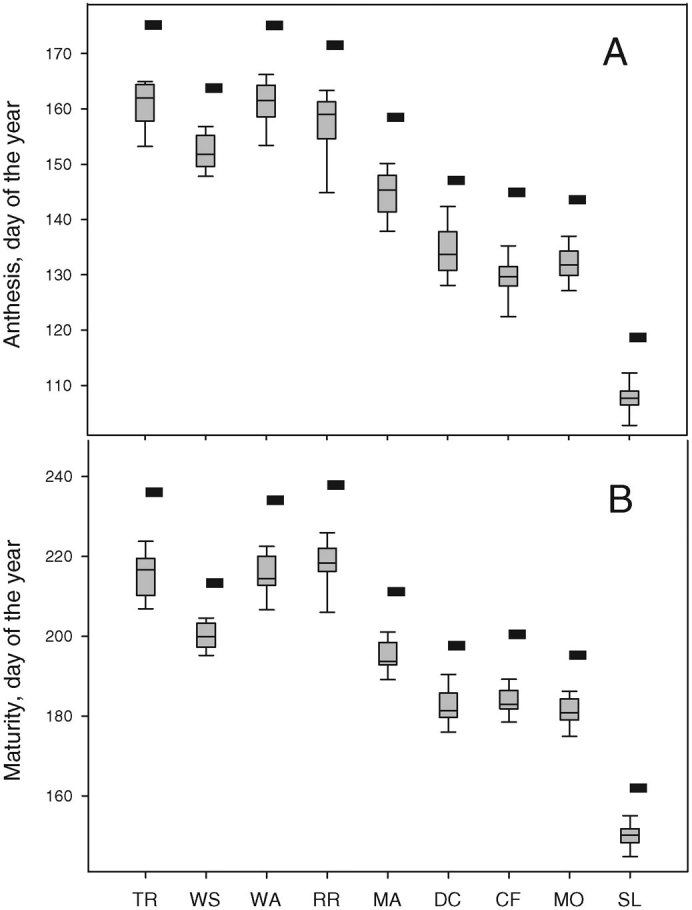
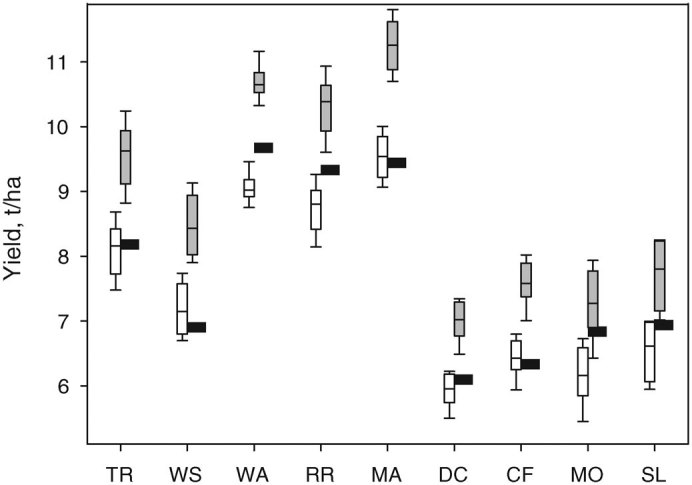
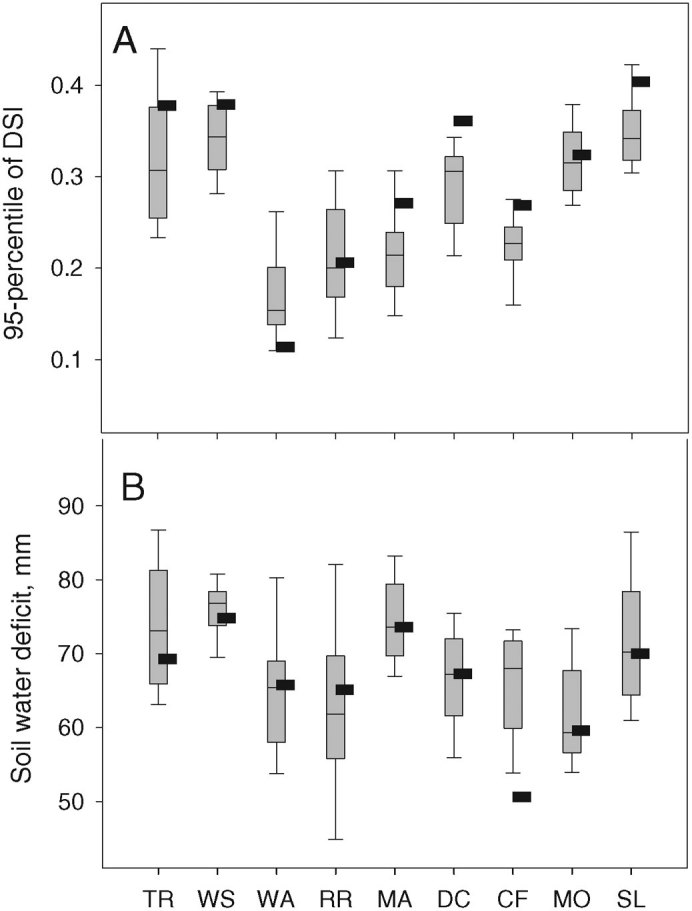
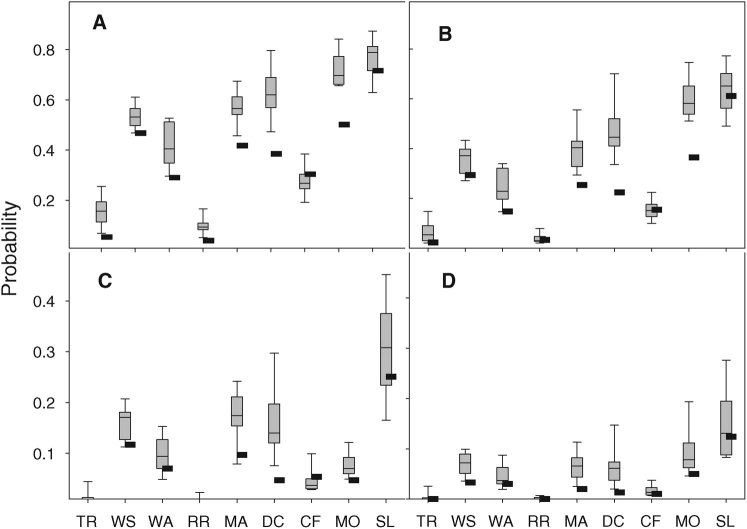
New crop cultivars will be required for a changing climate characterised by increased summer drought and heat stress in Europe. However, the uncertainty in climate predictions poses a challenge to crop scientists and breeders who have limited time and resources and must select the most appropriate traits for improvement. Modelling is a powerful tool to quantify future threats to crops and hence identify targets for improvement. We have used a wheat simulation model combined with local-scale climate scenarios to predict impacts of heat stress and drought on winter wheat in Europe. Despite the lower summer precipitation projected for 2050s across Europe, relative yield losses from drought is predicted to be smaller in the future, because wheat will mature earlier avoiding severe drought. By contrast, the risk of heat stress around flowering will increase, potentially resulting in substantial yield losses for heat sensitive cultivars commonly grown in northern Europe.
Figures
References
-
- Meehl G. A. et al.. The WCRP CMIP3 multi-model dataset: A new era in climate change research. Bull. Amer. Meteorol. Soc. 88 (2007).
-
- Solomon S. et al.. Climate Change 2007: The Physical Science Basis. 996. (Cambridge University Press, NY, 2007).
-
- Bacon M. A. Water use efficiency in plant biology. in Biological Science Series 327 (Blackwell Publishing, Oxford, 2004).
-
- Weisheimer A. & Palmer T. N. Changing frequency of occurrence of extreme seasonal-mean temperatures under global warming. Geophys. Res. Let. 32, L20721 (2005).
-
- Beniston M. et al.. Future extreme events in European climate: an exploration of regional climate model projections. Climatic Change 81, 71–95 (2007).
Publication types
MeSH terms
Grants and funding
LinkOut - more resources
Full Text Sources
