

The time variation of dose rate artificially increased by the Fukushima nuclear crisis
- PMID: 22355606
- PMCID: PMC3216573
- DOI: 10.1038/srep00087
The time variation of dose rate artificially increased by the Fukushima nuclear crisis
Abstract
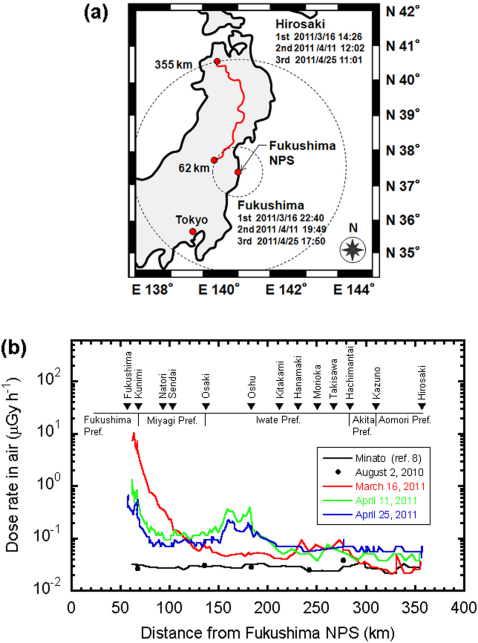
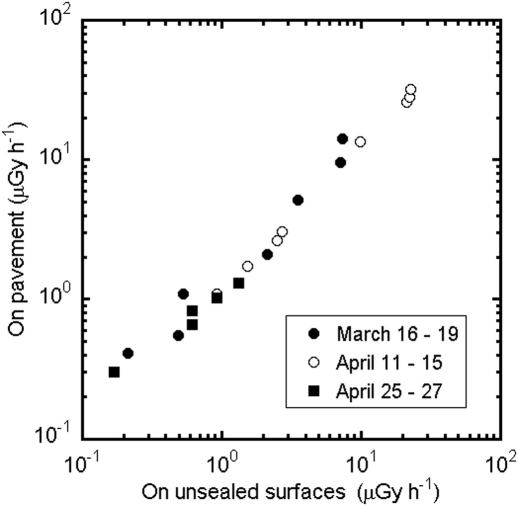
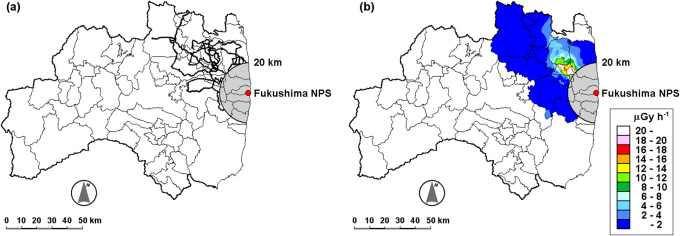
A car-borne survey for dose rate in air was carried out in March and April 2011 along an expressway passing northwest of the Fukushima Dai-ichi Nuclear Power Station which released radionuclides starting after the Great East Japan Earthquake on March 11, 2011, and in an area closer to the Fukushima NPS which is known to have been strongly affected. Dose rates along the expressway, i.e. relatively far from the power station were higher after than before March 11, in some places by several orders of magnitude, implying that there were some additional releases from Fukushima NPS. The maximum dose rate in air within the high level contamination area was 36 μGy h⁻¹, and the estimated maximum cumulative external dose for evacuees who came from Namie Town to evacuation sites (e.g. Fukushima, Koriyama and Nihonmatsu Cities) was 68 mSv. The evacuation is justified from the viewpoint of radiation protection.
Figures
References
-
- Monateersky R. Giant shock rattles ideas about quake behavior. Nature 471, 274 (2011). - PubMed
-
- Ozawa S. et al.. Coseismic and postseismic slip of the 2011 magnitude-9 Tohoku-Oki earthquake. Nature 475, 373–376 (2011). - PubMed
-
- Tanimoto T., Uchida N., Kodama Y., Teshima T. & Taniguchi S. Safety of workers at the Fukushima Daiichi nuclear power plant. Lancet 377, 1489–1490 (2011). - PubMed
-
- Butler C. Radioactivity spreads in Japan. Nature 471, 555–556 (2011). - PubMed
-
- Matsumura H., Saito K., Ishioka J. & Uwamino Y. Behavior of radioactive materials from Fukushima Daiichi nuclear power station obtained by radiation san on the expressways. J. At. Energy Soc. Jpn. 10, 152–162 (2011).
Publication types
MeSH terms
Substances
LinkOut - more resources
Full Text Sources
Miscellaneous
