

Single molecule detection from a large-scale SERS-active Au₇₉Ag₂₁ substrate
- PMID: 22355629
- PMCID: PMC3216594
- DOI: 10.1038/srep00112
Single molecule detection from a large-scale SERS-active Au₇₉Ag₂₁ substrate
Abstract
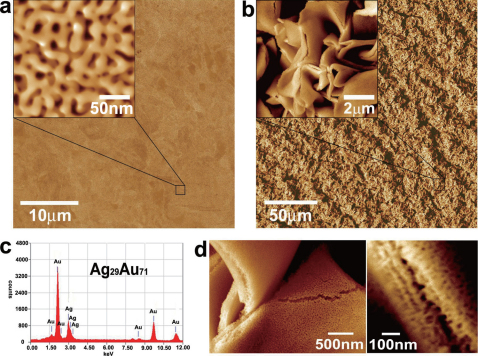
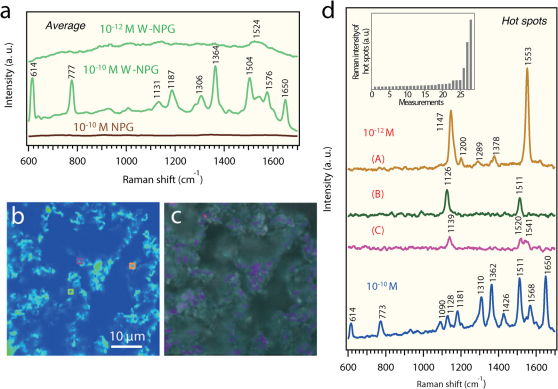
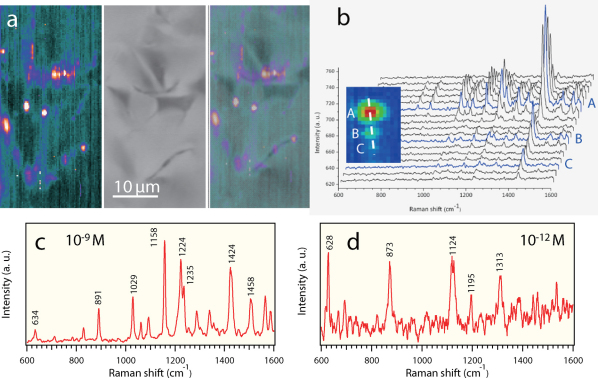
Detecting and identifying single molecules are the ultimate goal of analytic sensitivity. Single molecule detection by surface-enhanced Raman scattering (SM-SERS) depends predominantly on SERS-active metal substrates that are usually colloidal silver fractal clusters. However, the high chemical reactivity of silver and the low reproducibility of its complicated synthesis with fractal clusters have been serious obstacles to practical applications of SERS, particularly for probing single biomolecules in extensive physiological environments. Here we report a large-scale, free standing and chemically stable SERS substrate for both resonant and nonresonant single molecule detection. Our robust substrate is made from wrinkled nanoporous Au₇₉Ag₂₁ films that contain a high number of electromagnetic "hot spots" with a local SERS enhancement larger than 10⁹. This biocompatible gold-based SERS substrate with superior reproducibility, excellent chemical stability and facile synthesis promises to be an ideal candidate for a wide range of applications in life science and environment protection.
Figures

Similar articles
-
Single-Molecule Surface-Enhanced Raman Scattering Sensitivity of Ag-Core Au-Shell Nanoparticles: Revealed by Bi-Analyte Method.J Phys Chem Lett. 2013 Apr 4;4(7):1167-71. doi: 10.1021/jz400496n. Epub 2013 Mar 25. J Phys Chem Lett. 2013. PMID: 26282037
-
Facile Fabrication of Large-Scale Silver Nanowire Bilayer Films and Its Application as Sensitive and Reproducible Surface-Enhanced Raman Scattering Substrates.J Nanosci Nanotechnol. 2017 Jan;17(1):690-95. doi: 10.1166/jnn.2017.12544. J Nanosci Nanotechnol. 2017. PMID: 29633806
-
Surface-enhanced Raman scattering on single-wall carbon nanotubes.Philos Trans A Math Phys Eng Sci. 2004 Nov 15;362(1824):2361-73. doi: 10.1098/rsta.2004.1445. Philos Trans A Math Phys Eng Sci. 2004. PMID: 15482983
-
Surface-enhanced Raman scattering: realization of localized surface plasmon resonance using unique substrates and methods.Anal Bioanal Chem. 2009 Aug;394(7):1747-60. doi: 10.1007/s00216-009-2762-4. Epub 2009 Apr 22. Anal Bioanal Chem. 2009. PMID: 19384546 Review.
-
Lighting up the Raman signal of molecules in the vicinity of graphene related materials.Acc Chem Res. 2015 Jul 21;48(7):1862-70. doi: 10.1021/ar500466u. Epub 2015 Jun 9. Acc Chem Res. 2015. PMID: 26056861 Review.
Cited by
-
Morphological and SERS Properties of Silver Nanorod Array Films Fabricated by Oblique Thermal Evaporation at Various Substrate Temperatures.Nanoscale Res Lett. 2015 Dec;10(1):962. doi: 10.1186/s11671-015-0962-8. Epub 2015 Jun 10. Nanoscale Res Lett. 2015. PMID: 26061442 Free PMC article.
-
Trends in Application of SERS Substrates beyond Ag and Au, and Their Role in Bioanalysis.Biosensors (Basel). 2022 Nov 3;12(11):967. doi: 10.3390/bios12110967. Biosensors (Basel). 2022. PMID: 36354477 Free PMC article. Review.
-
Solid state pathways to complex shape evolution and tunable porosity during metallic crystal growth.Sci Rep. 2013;3:2642. doi: 10.1038/srep02642. Sci Rep. 2013. PMID: 24026532 Free PMC article.
-
Thermally-induced miniaturization for micro- and nanofabrication: progress and updates.Lab Chip. 2014 Sep 21;14(18):3475-88. doi: 10.1039/c4lc00528g. Epub 2014 Jul 30. Lab Chip. 2014. PMID: 25075652 Free PMC article. Review.
-
A rapid method to authenticate vegetable oils through surface-enhanced Raman scattering.Sci Rep. 2016 Mar 18;6:23405. doi: 10.1038/srep23405. Sci Rep. 2016. PMID: 26987802 Free PMC article.
References
-
- Nie S. & Emory S. R. Probing single molecules and single nanoparticles by surface-enhanced Raman scattering. Science 275, 1102–1106 (1997). - PubMed
-
- Kinkhabwala A. et al.. Large single-molecule fluorescence enhancements produced by a bowtie nanoantenna. Nature Photonics 3, 654–657 (2009).
-
- Celebrano M., Kukura P., Renn A. & Sandoghdar V. Single-molecule imaging by optical absorption. Nat. Photon. 5, 95–98 (2011).
-
- Domke K. F., Zhang D. & Pettinger B. Toward Raman fingerprints of single dye molecules at atomically smooth Au(111). J. Am. Chem. Soc. 128, 14721–14727 (2006). - PubMed
-
- Fang Y., Seong N.-H. & Dlott D. D. Measurement of the distribution of site enhancements in surface-enhanced Raman scattering. Science 321, 388–392 (2008). - PubMed
Publication types
LinkOut - more resources
Full Text Sources
Other Literature Sources
Miscellaneous
