. 2011:1:118.
doi: 10.1038/srep00118. Epub 2011 Oct 14.

A rapid and robust tri-color flow cytometry assay for monitoring malaria parasite development

Affiliations

A rapid and robust tri-color flow cytometry assay for monitoring malaria parasite development

Benoît Malleret et al. Sci Rep. 2011.

Abstract

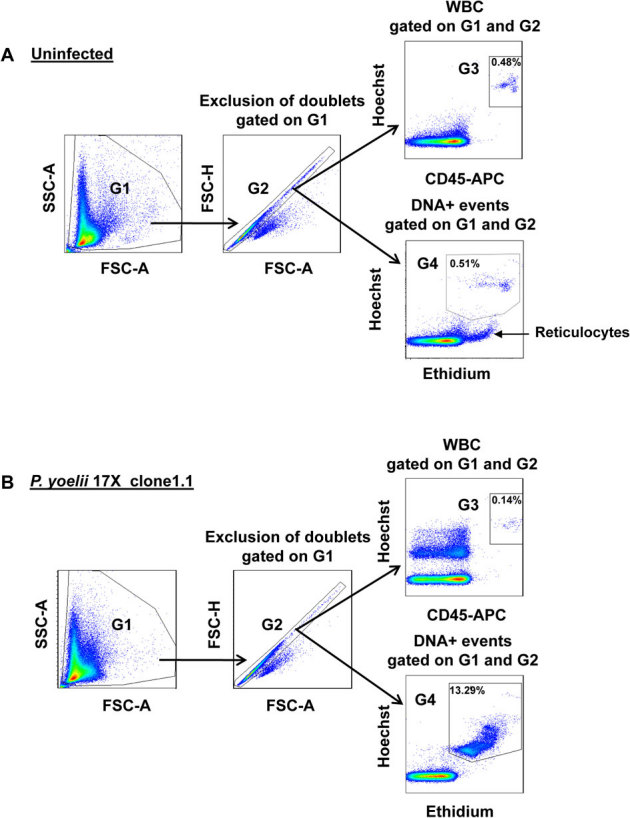
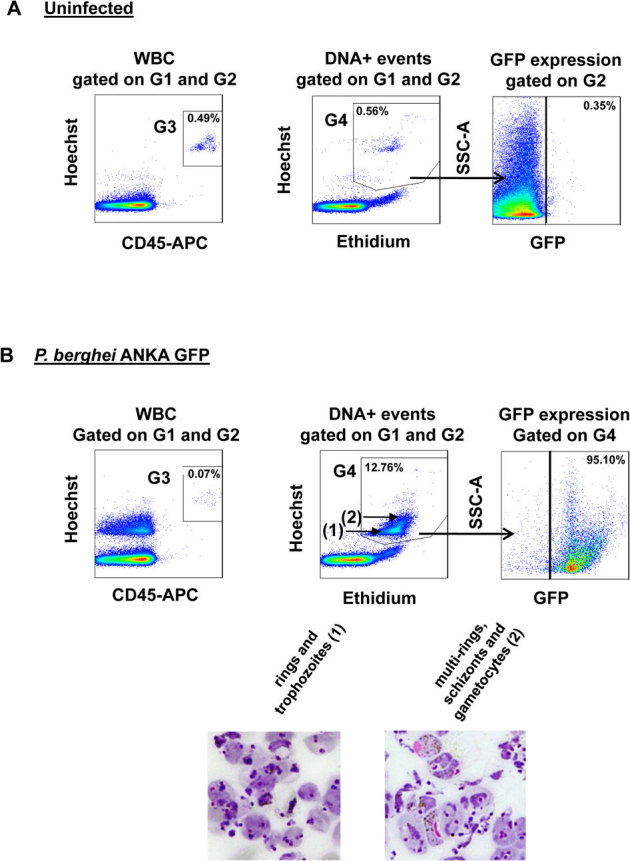
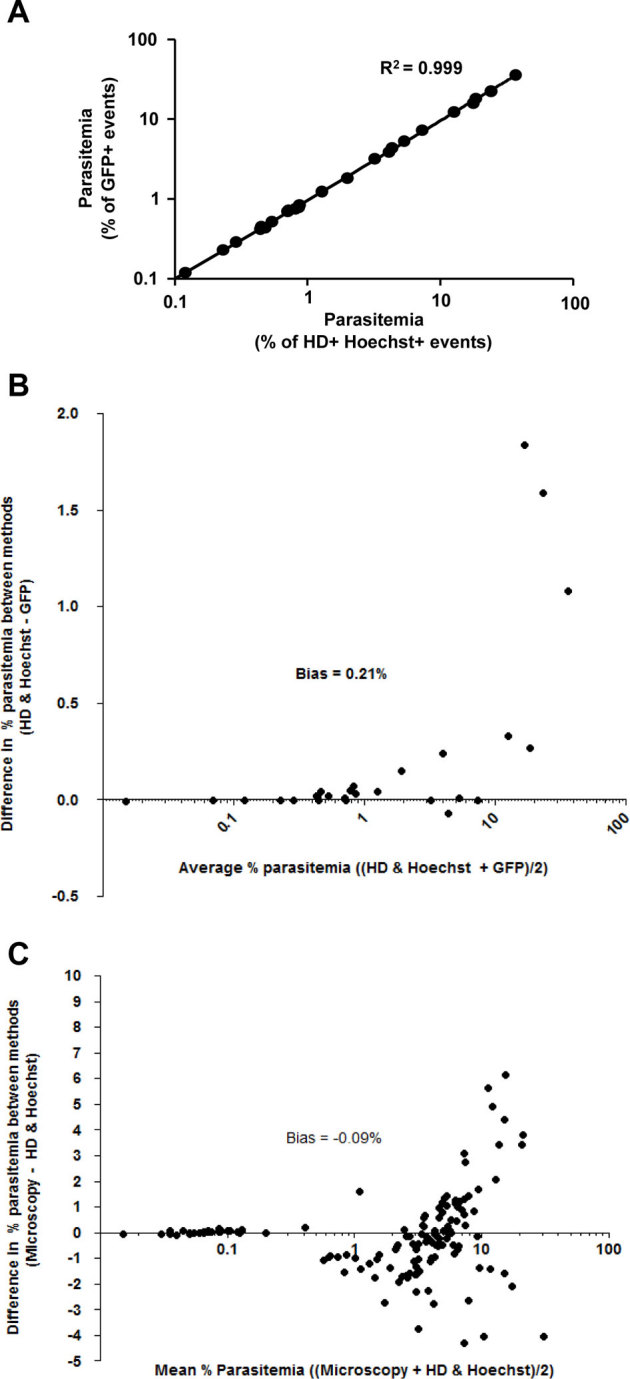
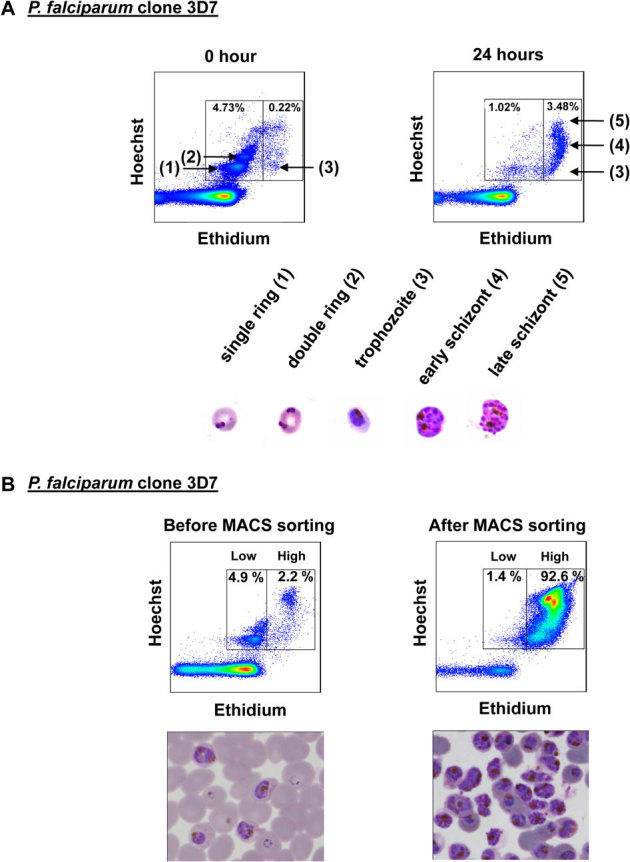
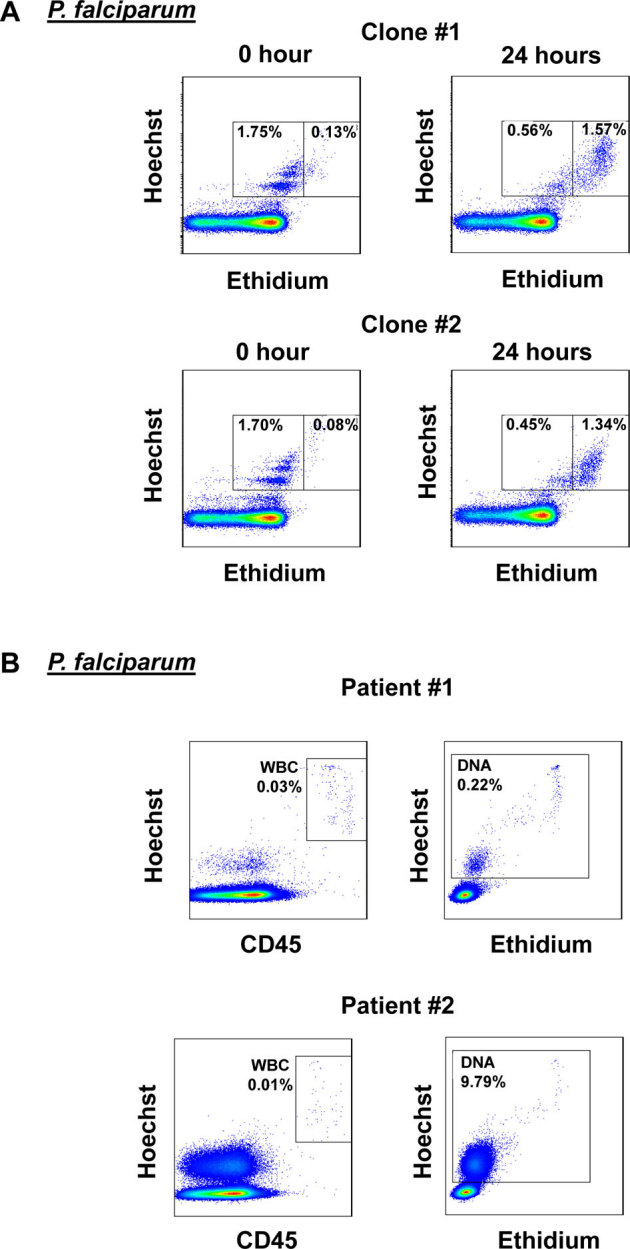
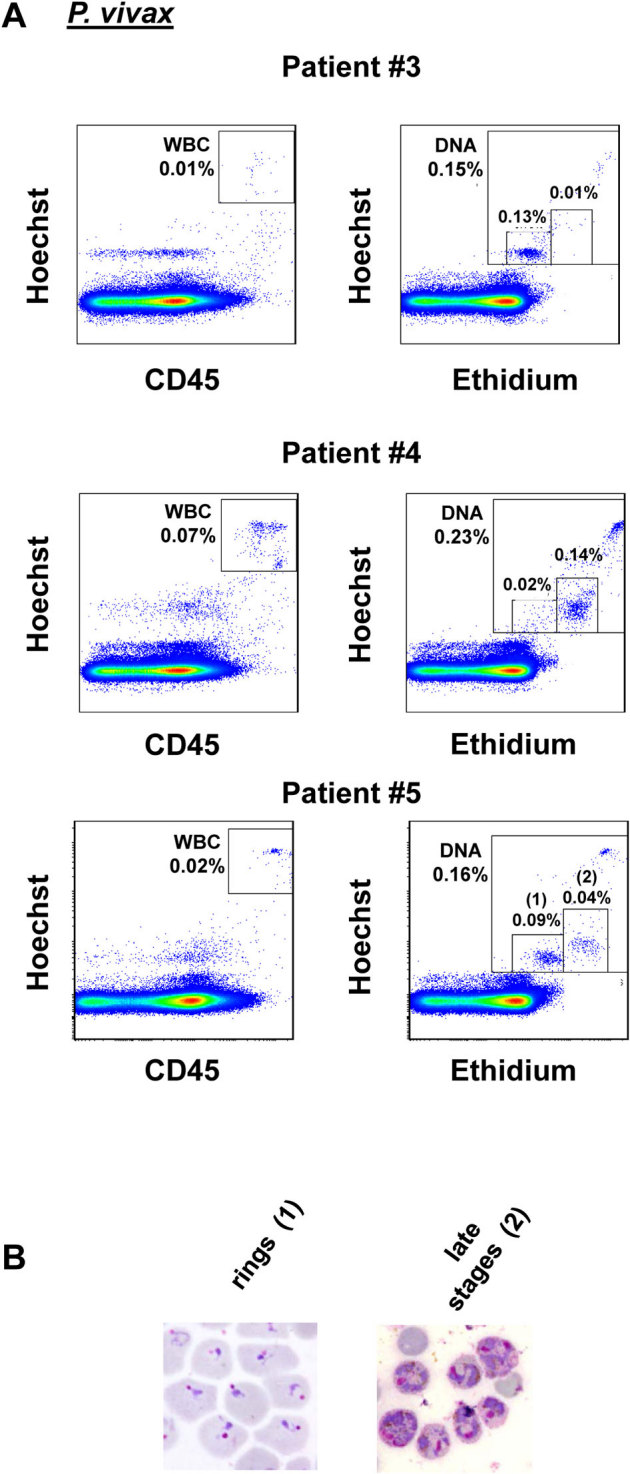
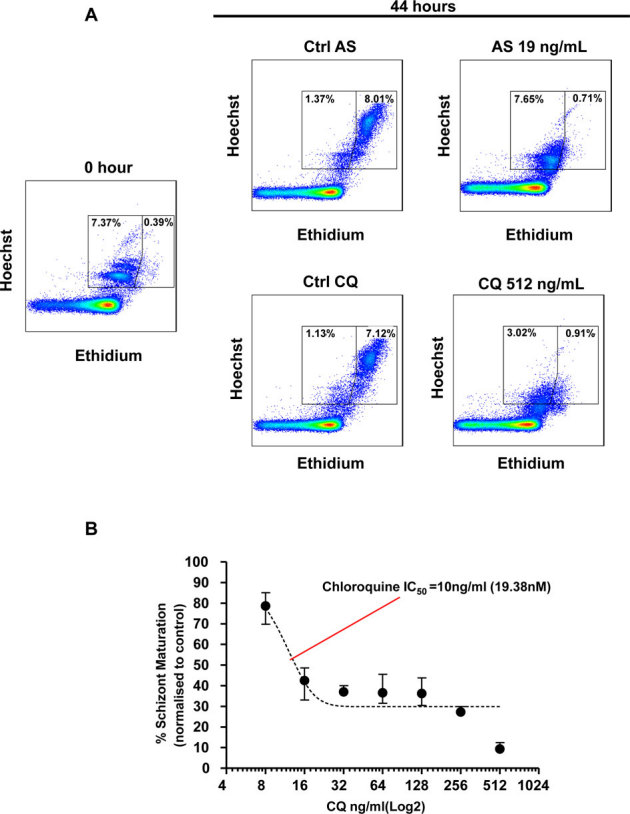
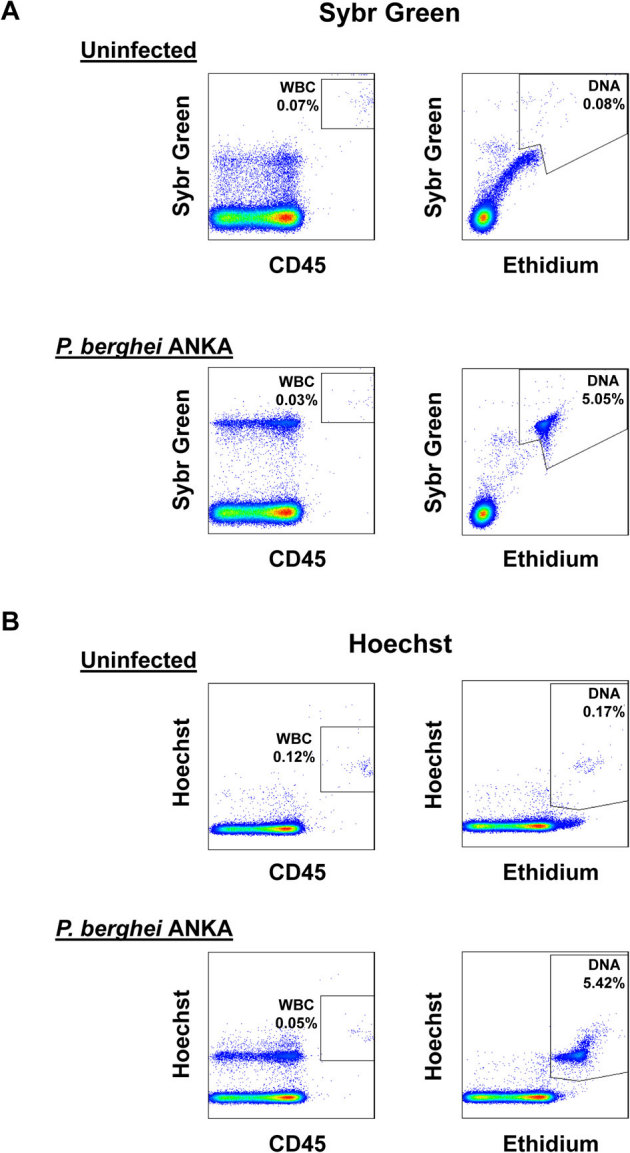
Microscopic examination of Giemsa-stained thin blood smears remains the gold standard method used to quantify and stage malaria parasites. However, this technique is tedious, and requires trained microscopists. We have developed a fast and simple flow cytometry method to quantify and stage, various malaria parasites in red blood cells in whole blood or in vitro cultured Plasmodium falciparum. The parasites were stained with dihydroethidium and Hoechst 33342 or SYBR Green I and leukocytes were identified with an antibody against CD45. Depending on the DNA stains used, samples were analyzed using different models of flow cytometers. This protocol, which does not require any washing steps, allows infected red blood cells to be distinguished from leukocytes, as well as allowing non-infected reticulocytes and normocytes to be identified. It also allows assessing the proportion of parasites at different developmental stages. Lastly, we demonstrate how this technique can be applied to antimalarial drug testing.


Figures

Figure 1
Figure 1. Flow cytometry gating strategy for P. yoelii parasitemia determination.
The TCM was performed with blood from (A) an uninfected C57BL/6J mouse and (B) a mouse infected 5 days previously with P. yoelii 17X clone 1.1. Red blood cells and white blood cells are first gated (G1) on a forward scatter/side scatter (FSC-A/SSC-A) dot plot. The G1 events are visualized using a FSC-A/FSC-H dot plot and the singlets (single cells) are gated on gate G2. Cells on G2 are simultaneously displayed on both CD45/Hoechst and Ethidium/Hoechst dot plots. CD45-positive white blood cells (WBCs) appear in gate G3 and are subtracted from all DNA- and RNA-containing cells (gate G4) to calculate the parasitemia.
Figure 2
Figure 2. Flow cytometry gating for P. berghei ANKA parasitemia determination.
The TCM method was performed with blood from (A) an uninfected C57BL/6J mouse and (B) a mouse infected 7 days previously with P. berghei ANKA expressing GFP. The same flow cytometry gating strategy described in Figure 1 was used. On the extreme right panel, GFP expression for cells present in gate G4 was displayed on the SSC/GFP dot plot. In gate G4, the parasite population in (1) is composed of a mix of rings and trophozoites and in (2) of a mix of multi-rings, schizonts and gametocytes as shown in representative Giemsa-stained smears obtained after sorting by flow cytometry.
Figure 3
Figure 3. Correlation analysis with Spearman test and agreement analysis with Bland-Altman statistical test.
(A) Correlation between parasitemia of P. berghei ANKA GFP parasitemia monitored using GFP expression and with TCM. (A) Spearman rank correlation analysis of the parasitemia determined from GFP expression and the TCM in blood samples from 27 infected mice (slope = 1.044, R2 = 0.999). (B) Bland-Altman agreement analysis between the parasitemia quantified with GFP expression and with TCM (bias = 0.21%). (C) Bland-Altman agreement analysis between the parasitemia quantified with microscopy counting and TCM (bias = −0.09%).
Figure 4
Figure 4. Monitoring of P. falciparum parasitemia grown in vitro by the TCM.
(A) Ethidium/Hoechst dot plot of parasites obtained from a synchronized culture of P. falciparum (3D7) after excluding debris and doublets. Cryopreserved parasites were thawed and stained by the TCM at two different times after thawing. The indicated cell populations were sorted by flow cytometry and stained with Giemsa; they corresponded to different parasite stages: (1) single ring, (2) double ring, (3) trophozoite, (4) early schizont and (5) late schizont. (B) Ethidium/Hoechst dot plot of parasites from an asynchronous culture of P. falciparum 3D7 before (left panel) and after (right panel) magnetic sorting using a MACS column. Predominantly, the stages containing the pigment (hemozoin) are in the Ethidiumhigh gate as shown in representative Giemsa-stained smears (right panel).
Figure 5
Figure 5. Determination of parasitemia in P. falciparum field isolates samples.
Cryopreserved parasites were thawed and stained by the TCM at two different times after thawing. (A) Ethidium/Hoechst dot plot of parasites from synchronized culture of two clones derived from a P. falciparum field isolate before and after 24 hours of culture. (B) Dot plots representing CD45/Hoechst and Ethidium/Hoechst staining of cells in whole blood from two patients from Thailand infected with P. falciparum. Note that the blue laser voltage was lower in this particular experiment.
Figure 6
Figure 6. Determination of parasitemia in P. vivax field isolates samples.
Cryopreserved whole blood from three different patients from Thailand were thawed and stained by the TCM after thawing. (A) Dot plots representing CD45/Hoechst and Ethidium/Hoechst staining of cells in whole blood from patients from Thailand infected with P. vivax. (B) Representative images of Giemsa-stained blood smears of the indicated parasite populations sorted by flow cytometry; they corresponded to rings (1) and late stages (2) i.e. trophozoites and schizonts.
Figure 7
Figure 7. Inhibition assay of P. falciparum schizont maturation after chloroquine or artesunate treatment.
(A) Ethidium/Hoechst dot plots of control and drug-treated synchronized P. falciparum clone 3D7 cultures before and after 44 hours of treatment with high dose artesunate (19 ng/ml) or chloroquine (512 ng/ml). (B) Dose response curve of P. falciparum 3D7 after 44 hours of chloroquine treatment, error bars represent the error on triplicate cultures.
Figure 8
Figure 8. Detection of P. berghei ANKA parasitemia using SYBR Green and a 2 laser flow cytometer.
The TCM method using SYBR Green (A) or Hoechst (B) was performed side by side with blood from an uninfected mouse or a mouse infected 7 days previously with P. berghei ANKA. The same flow cytometry gating strategy described in Figure 1 was used. Two parameters dot plots representing Ethidium/SYBR Green or Ethidium/Hoechst are compared. Gates containing WBC or cells containing DNA are indicated.

Similar articles

Cited by

References

    1. Greenwood B. M. et al.. Malaria: progress, perils, and prospects for eradication. J Clin Invest 118, 1266–1276 (2008). - PMC - PubMed
    1. Laveran A. Note sur un nouveau parasite trouve dans le sang de plusieurs malades atteints de fievre palustre. Bull Acad Med 9, 1235–1236 (1880).
    1. Giemsa G. Eine Vereinfachung und Vervollkommnung meiner Methylenazur-Methylenblau-Eosin-Färbemethode zur Erzielung der Romanowsky-Nochtschen Chromatinfärbung. Centralblatt für Bakteriologie 37, 308–311 (1904).
    1. Maguire J. D. et al.. Production and validation of durable, high quality standardized malaria microscopy slides for teaching, testing and quality assurance during an era of declining diagnostic proficiency. Malar J 5, 92 (2006). - PMC - PubMed
    1. Myler P., Saul A., Mangan T. & Kidson C. An automated assay of merozoite invasion of erythrocytes using highly synchronized Plasmodium falciparum cultures. Aust J Exp Biol Med Sci 60, 83–89 (1982). - PubMed

Publication types

MeSH terms