. 2011:1:134.
doi: 10.1038/srep00134. Epub 2011 Oct 31.

The metabolic footprint of aging in mice

Affiliations

The metabolic footprint of aging in mice

Riekelt H Houtkooper et al. Sci Rep. 2011.

Abstract

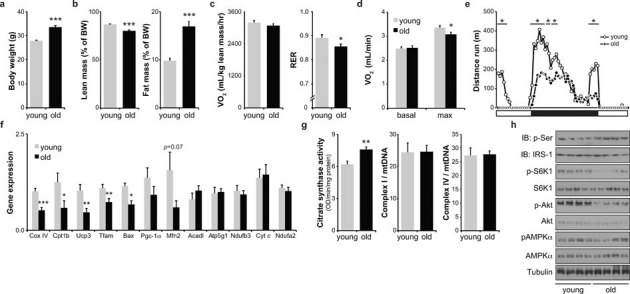
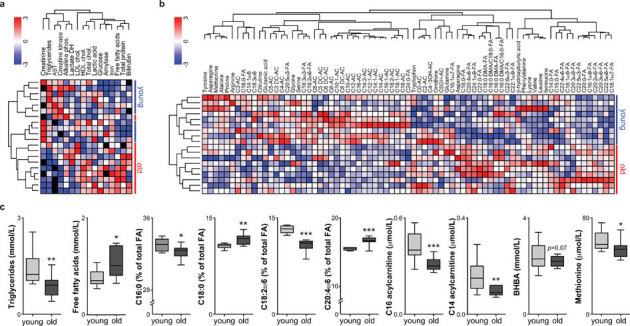
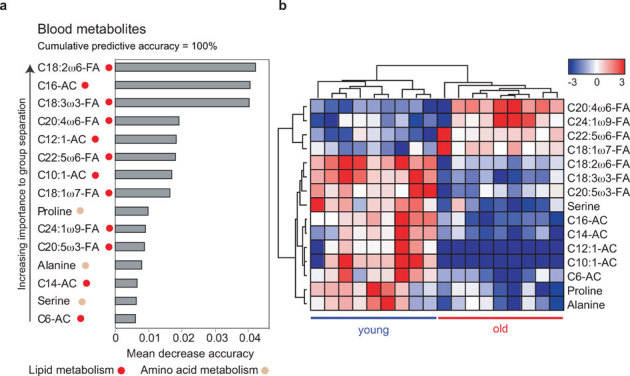
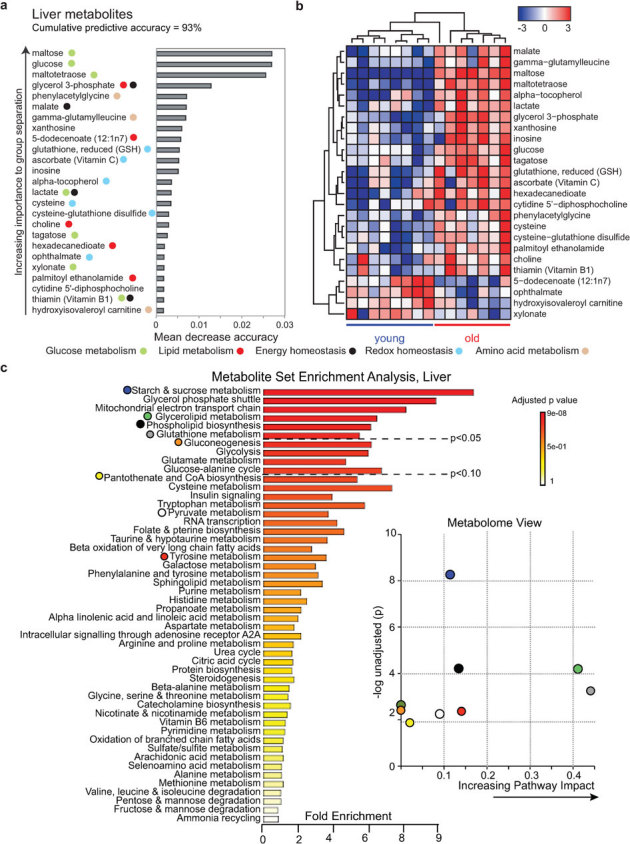
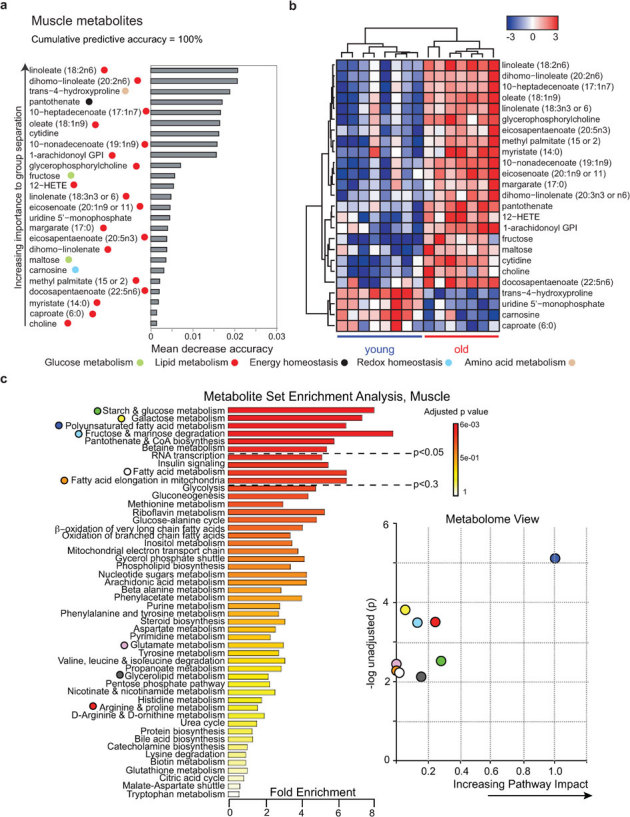
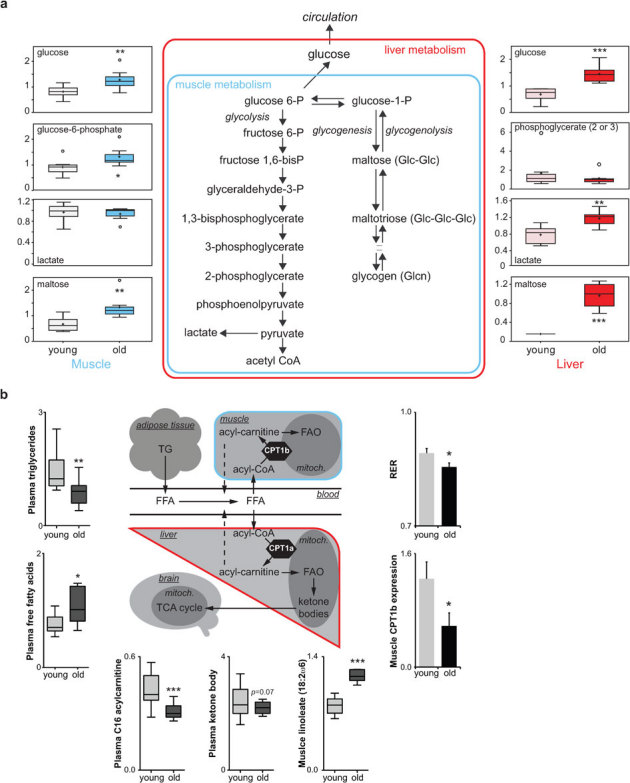
Aging is characterized by a general decline in cellular function, which ultimately will affect whole body homeostasis. Although DNA damage and oxidative stress all contribute to aging, metabolic dysfunction is a common hallmark of aging at least in invertebrates. Since a comprehensive overview of metabolic changes in otherwise healthy aging mammals is lacking, we here compared metabolic parameters of young and 2 year old mice. We systemically integrated in vivo phenotyping with gene expression, biochemical analysis, and metabolomics, thereby identifying a distinguishing metabolic footprint of aging. Among the affected pathways in both liver and muscle we found glucose and fatty acid metabolism, and redox homeostasis. These alterations translated in decreased long chain acylcarnitines and increased free fatty acid levels and a marked reduction in various amino acids in the plasma of aged mice. As such, these metabolites serve as biomarkers for aging and healthspan.


Figures

Figure 1
Figure 1. Clinical and molecular phenotyping of aging mice.
(A) Body weight. (B) Body composition. (C) Indirect calorimetry shows oxygen consumption (VO2) and respiratory exchange ratio (RER) during 24h recording. (D) Basal and maximum VO2 on a metabolic treadmill. (E) Twenty-four hours voluntary exercise recording. (F) Gene expression of young and old mice in gastrocnemius muscle (G) Enzymatic activity of citrate synthase (CS), and complex I and complex IV of oxidative phosphorylation in gastrocnemius muscle. (H) Western blot analysis of relevant metabolic signaling pathways in gastrocnemius muscle. pAMPKα represents phosphorylation/activation of the α-subunit of AMPK; Immunoprecipitated IRS1 was used to measure its phosphorylation on serine residues (p-Ser); p-S6K1 reflects S6K1 phosporylation/activation. Tubulin is used as a loading control. Values are expressed as mean±SEM; n = 6–10 (Fig 1A, n = 20). * p≤0.05; ** p≤0.01; *** p≤0.001.
Figure 2
Figure 2. Plasma biochemistry and targeted metabolomics.
(A) Two-way hierarchical clustering of plasma clinical biochemistry. (B) Two-way hierarchical clustering of targeted metabolomics data. Metabolites described by FA are erythrocyte fatty acids, whereas ACs denote plasma acylcarnitines. (C) Plasma levels of selected metabolites. Values are expressed as box-and-whisker plots; n = 10; * p≤0.05; ** p≤0.01; *** p≤0.001.
Figure 3
Figure 3. Metabolite and pathway enrichment of targeted metabolomics and microarray.
(A) To relate aging status to the blood metabolite expression data, we used random forest predictors. A random forest importance measure was used to rank metabolites according to their prognostic importance for aging status. We find that the 10 most important metabolites lead to an apparent predictive accuracy of 100%. (B) Supervised hierarchical clustering plot for visualizing the expression of the RF predictors (z-score normalized). The RF plot and the supervised hierarchical clustering plot show that the 15 most important metabolites stratify the samples according to their aging status. Metabolites described by FA are erythrocyte fatty acids, whereas ACs denote plasma acylcarnitines. A color code describes the pathway to which the respective metabolite belongs.
Figure 4
Figure 4. Aging biomarker identification and pathway analysis by global metabolomics in liver.
To relate aging status to the liver metabolite expression data, we used random forest predictors (A). Metabolites were ranked according to their increasing importance to group separation according to age. We find that the 25 and most important probesets lead to an apparent predictive accuracy of 93%. Colored symbols are used to indicate the pathways in which the metabolites play a role. Supervised hierarchical clustering plot (B) for visualizing the expression of the RF predictors (z-score normalized). The RF plot and the supervised hierarchical clustering plot show that the 25 most important metabolites stratify the samples according to their aging status. (C) Summary plot for metabolite set enrichment analysis (MSEA) (left panel) where metabolite sets are ranked according to Holm p-value with hatched lines showing the cut off of Holm p-value. Metabolome view (right panel) reflects on the x-axis increasing metabolic pathway impact according to the betweenness centrality measure, which reflects key nodes in metabolic pathways that have been significantly altered with aging.
Figure 5
Figure 5. Aging biomarker identification and pathway analysis by global metabolomics in muscle.
To relate aging status to the muscle metabolite expression data, we used random forest predictors (A). Metabolites were ranked according to their increasing importance to group separation according to age. We find that the 25 and most important probesets lead to an apparent predictive accuracy of 100%. Colored symbols are used to indicate the pathways in which the metabolites play a role. Supervised hierarchical clustering plot (B) for visualizing the expression of the RF predictors (z-score normalized). The RF plot and the supervised hierarchical clustering plot show that the 25 most important metabolites stratify the samples according to their aging status. (C) Summary plot for metabolite set enrichment analysis (MSEA) (left panel) and metabolome view (right panel) as discussed in Figure 4C.
Figure 6
Figure 6. Models of aging-related changes in glucose and fat metabolism.
(A) A summary of the biochemical pathways of glucose metabolism affected in muscle and liver. Metabolites that changed between young and old are indicated in bold; representative metabolites data from the muscle and liver are shown in the left and right margin respectively. In summary, accumulation of the glycogen intermediates maltose and maltotetraose suggests increased liver glycogen breakdown in old mice. On the other hand, increased lactate and reduced glycolysis intermediates suggest elevated glycolysis. Elevated glucose and glucose--phosphate in muscle, in combination with the unchanged lactate levels, suggest decreased glucose disposal in muscle, either by breakdown or glycogen synthesis. Indeed, the increase in muscle maltose levels is consistent with increased glycogenolysis. (B) A schematic representation of fat metabolism, showing representative changes. Plasma triglycerides were decreased, whereas free fatty acids were increased in old mice, suggesting enhanced triglyceride deposition in tissues, as well as enhanced liberation and/or decreased breakdown of fatty acids. Decreased FAO is supported by accumulation fatty acid in the muscle, decreased leak of acylcarnitines into plasma (dashed line) and reduced ketogenesis. Decreased Cpt1b expression in muscle likely contributes to the decreased FAO, also explaining lower plasma acylcarnitine levels. The fact that RER is lower in old mice —indicative for relative reliance on fat oxidation— suggests that glucose oxidation is also hampered and fat metabolism is still the primary source for ATP generation. Values are expressed as mean±SEM or as box-and-whisker plots. * p≤0.05; ** p≤0.01; *** p≤0.001.

Similar articles

Cited by

References

    1. Houtkooper R. H., Williams R. W. & Auwerx J. Metabolic networks of longevity. Cell 142, 9–14 (2010). - PMC - PubMed
    1. Bai P. et al.. PARP-1 Inhibition Increases Mitochondrial Metabolism through SIRT1 Activation. Cell Metab 13, 461–468 (2011). - PMC - PubMed
    1. Sahin E. et al.. Telomere dysfunction induces metabolic and mitochondrial compromise. Nature 470, 359–365 (2011). - PMC - PubMed
    1. Fontana L., Partridge L. & Longo V. D. Extending healthy life span–from yeast to humans. Science 328, 321–326 (2010). - PMC - PubMed
    1. Kenyon C. J. The genetics of ageing. Nature 464, 504–512 (2010). - PubMed

Publication types