

Enhancing apoptosis in TRAIL-resistant cancer cells using fundamental response rules
- PMID: 22355661
- PMCID: PMC3216625
- DOI: 10.1038/srep00144
Enhancing apoptosis in TRAIL-resistant cancer cells using fundamental response rules
Abstract
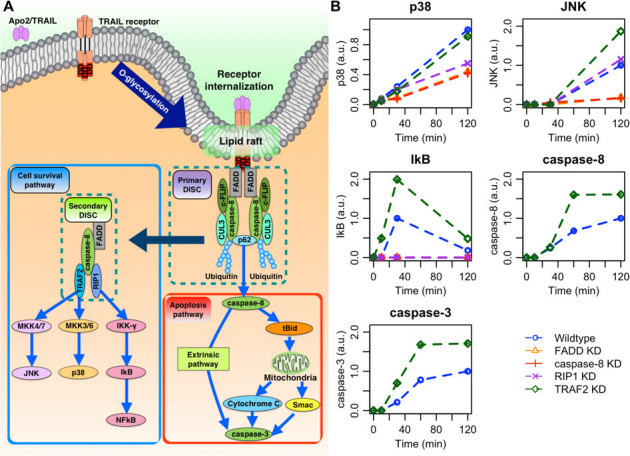
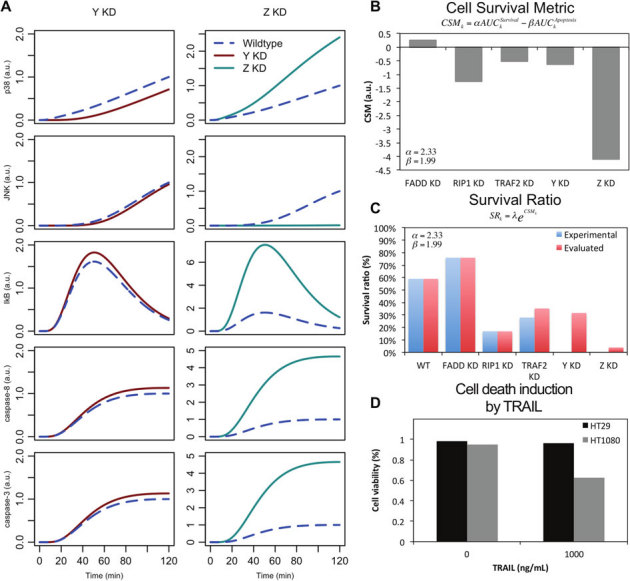
The tumor necrosis factor related apoptosis-inducing ligand (TRAIL) induces apoptosis in malignant cells, while leaving other cells mostly unharmed. However, several carcinomas remain resistant to TRAIL. To investigate the resistance mechanisms in TRAIL-stimulated human fibrosarcoma (HT1080) cells, we developed a computational model to analyze the temporal activation profiles of cell survival (IκB, JNK, p38) and apoptotic (caspase-8 and -3) molecules in wildtype and several (FADD, RIP1, TRAF2 and caspase-8) knock-down conditions. Based on perturbation-response approach utilizing the law of information (signaling flux) conservation, we derived response rules for population-level average cell response. From this approach, i) a FADD-independent pathway to activate p38 and JNK, ii) a crosstalk between RIP1 and p38, and iii) a crosstalk between p62 and JNK are predicted. Notably, subsequent simulations suggest that targeting a novel molecule at p62/sequestosome-1 junction will optimize apoptosis through signaling flux redistribution. This study offers a valuable prospective to sensitive TRAIL-based therapy.
Figures
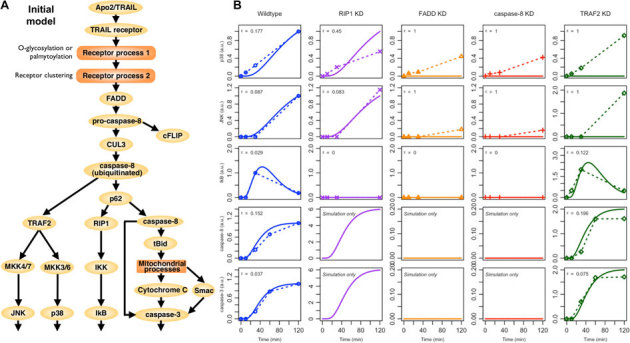
 between simulations and
experimental data for the ith molecule in the
kth condition is calculated based on the area
between experimental and simulation curves (see Eq. 5 in Methods).
*caspase-8 KD also refers to pro-caspase-8 KD.
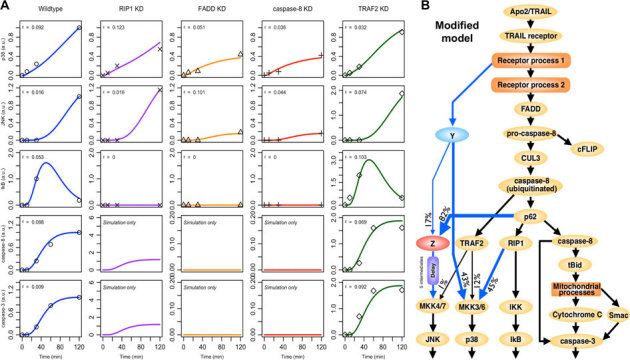
between simulations and
experimental data for the ith molecule in the
kth condition is calculated based on the area
between experimental and simulation curves (see Eq. 5 in Methods).
*caspase-8 KD also refers to pro-caspase-8 KD.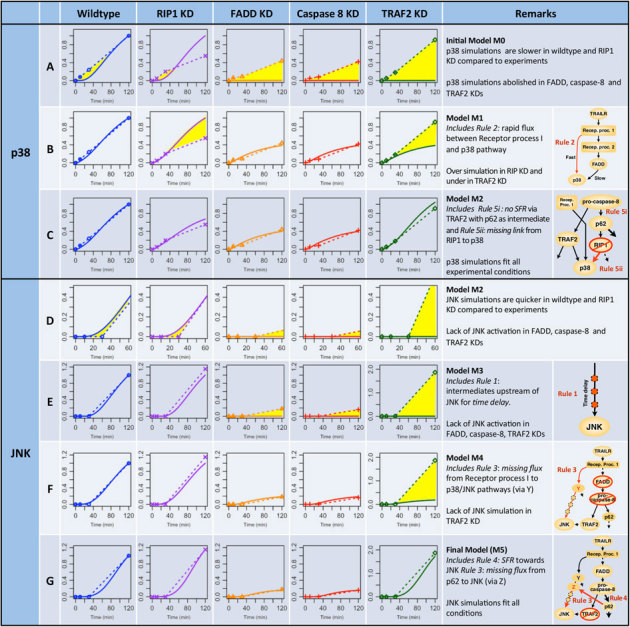
Similar articles
-
Molecular determinants of kinase pathway activation by Apo2 ligand/tumor necrosis factor-related apoptosis-inducing ligand.J Biol Chem. 2005 Dec 9;280(49):40599-608. doi: 10.1074/jbc.M509560200. Epub 2005 Oct 15. J Biol Chem. 2005. PMID: 16227629
-
MAPK p38 and JNK have opposing activities on TRAIL-induced apoptosis activation in NSCLC H460 cells that involves RIP1 and caspase-8 and is mediated by Mcl-1.Apoptosis. 2013 Jul;18(7):851-60. doi: 10.1007/s10495-013-0829-3. Apoptosis. 2013. PMID: 23456625
-
Distinct signaling pathways in TRAIL- versus tumor necrosis factor-induced apoptosis.Mol Cell Biol. 2006 Nov;26(21):8136-48. doi: 10.1128/MCB.00257-06. Epub 2006 Aug 28. Mol Cell Biol. 2006. PMID: 16940186 Free PMC article.
-
Non-canonical kinase signaling by the death ligand TRAIL in cancer cells: discord in the death receptor family.Cell Death Differ. 2013 Jul;20(7):858-68. doi: 10.1038/cdd.2013.28. Epub 2013 Apr 12. Cell Death Differ. 2013. PMID: 23579241 Free PMC article. Review.
-
Biochemical analysis of the native TRAIL death-inducing signaling complex.Methods Mol Biol. 2008;414:221-39. doi: 10.1007/978-1-59745-339-4_16. Methods Mol Biol. 2008. PMID: 18175822 Review.
Cited by
-
The apoptotic mechanisms of MT-6, a mitotic arrest inducer, in human ovarian cancer cells.Sci Rep. 2017 Apr 7;7:46149. doi: 10.1038/srep46149. Sci Rep. 2017. PMID: 28387244 Free PMC article.
-
Systems biology of death receptor networks: live and let die.Cell Death Dis. 2014 May 29;5(5):e1259. doi: 10.1038/cddis.2014.160. Cell Death Dis. 2014. PMID: 24874731 Free PMC article. Review.
-
A systems biology approach to suppress TNF-induced proinflammatory gene expressions.Cell Commun Signal. 2013 Nov 7;11:84. doi: 10.1186/1478-811X-11-84. Cell Commun Signal. 2013. PMID: 24199619 Free PMC article.
-
Parameter-less approaches for interpreting dynamic cellular response.J Biol Eng. 2014 Aug 19;8:23. doi: 10.1186/1754-1611-8-23. eCollection 2014. J Biol Eng. 2014. PMID: 25183996 Free PMC article.
-
Rab25 Small GTPase Mediates Secretion of Tumor Necrosis Factor Receptor Superfamily Member 11b (osteoprotegerin) Protecting Cancer Cells from Effects of TRAIL.J Genet Syndr Gene Ther. 2013;4:1000153. doi: 10.4172/2157-7412.1000153. J Genet Syndr Gene Ther. 2013. PMID: 25520884 Free PMC article.
References
-
- Finn O. J. Cancer immunology. N. Engl. J. Med. 358, 2704–2715 (2008). - PubMed
-
- Zitvogel L., Apetoh L., Ghiringhelli F. & Kroemer G. Immunological aspects of cancer chemotherapy. Nat. Rev. Immunol. 8, 59–73 (2008). - PubMed
-
- Wang S. The promise of cancer therapeutics targeting the TNF-related apoptosis-inducing ligand and TRAIL receptor pathway. Oncogene 27, 6207–6215 (2008). - PubMed
-
- Johnstone R. W., Frew A. J. & Smyth M. J. The TRAIL apoptotic pathway in cancer onset, progression and therapy. Nat. Rev. Cancer 8, 782–798 (2008). - PubMed
Publication types
MeSH terms
Substances
LinkOut - more resources
Full Text Sources
Research Materials
Miscellaneous
