. 2012:2:264.
doi: 10.1038/srep00264. Epub 2012 Feb 14.

Transcriptomic landscape of breast cancers through mRNA sequencing

Affiliations

Transcriptomic landscape of breast cancers through mRNA sequencing

Jeyanthy Eswaran et al. Sci Rep. 2012.

Abstract

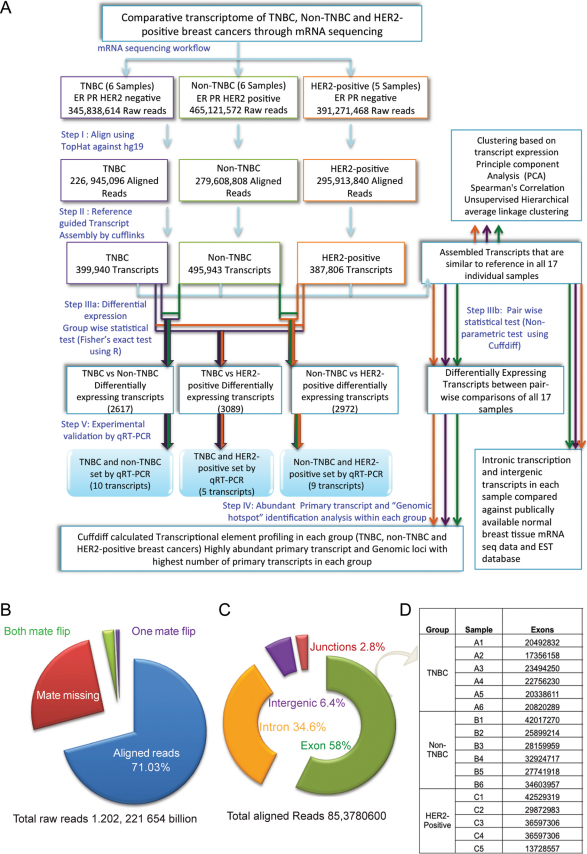
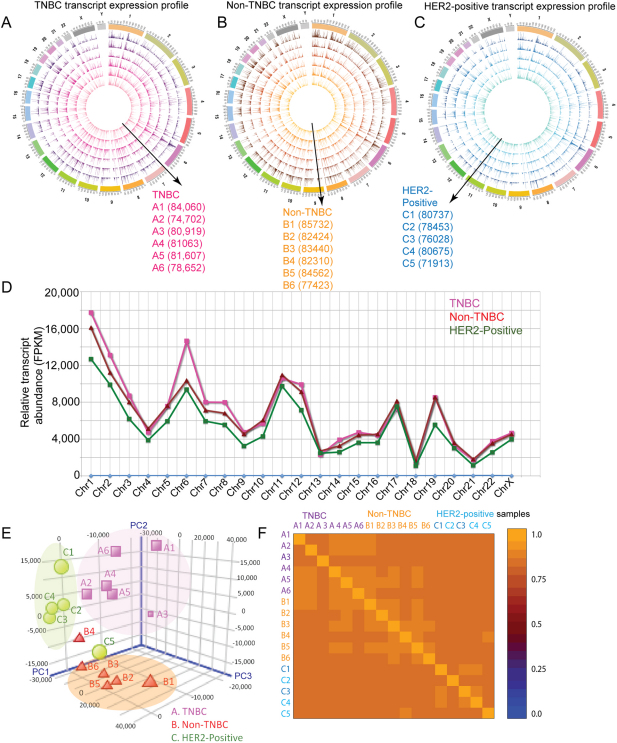
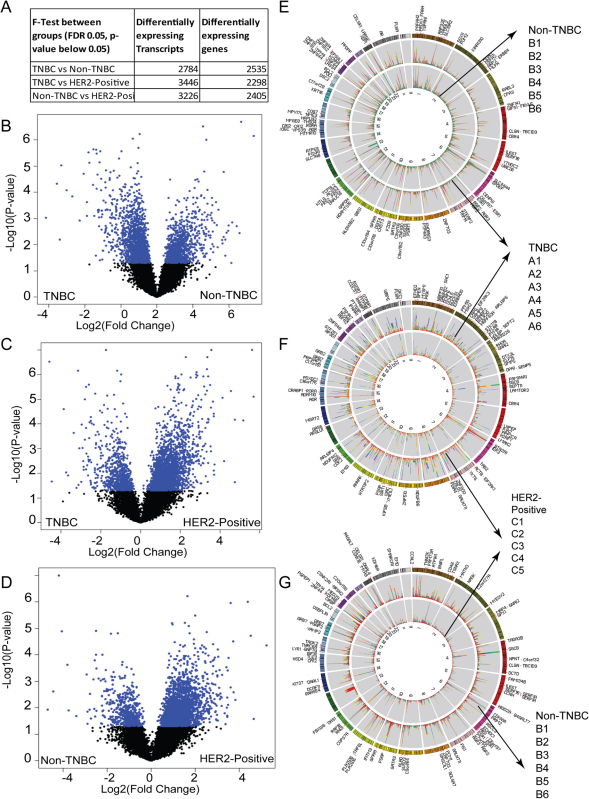
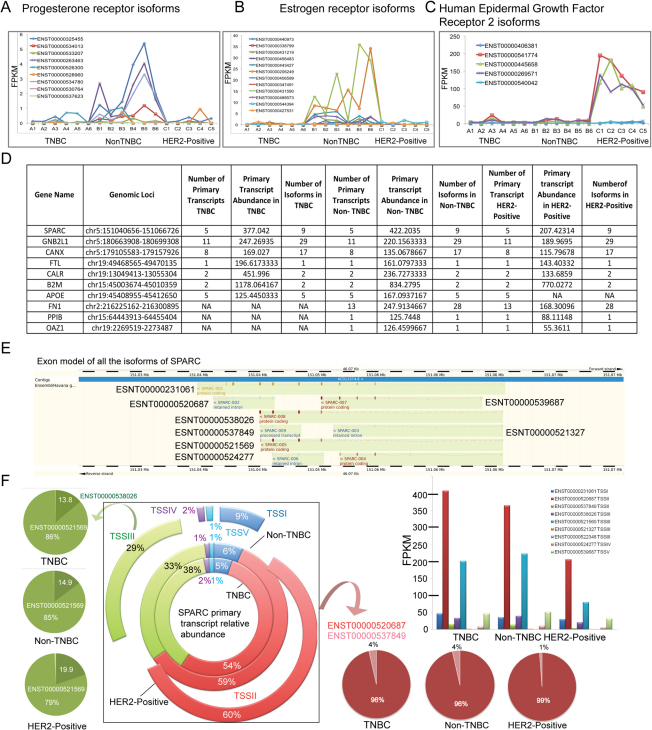
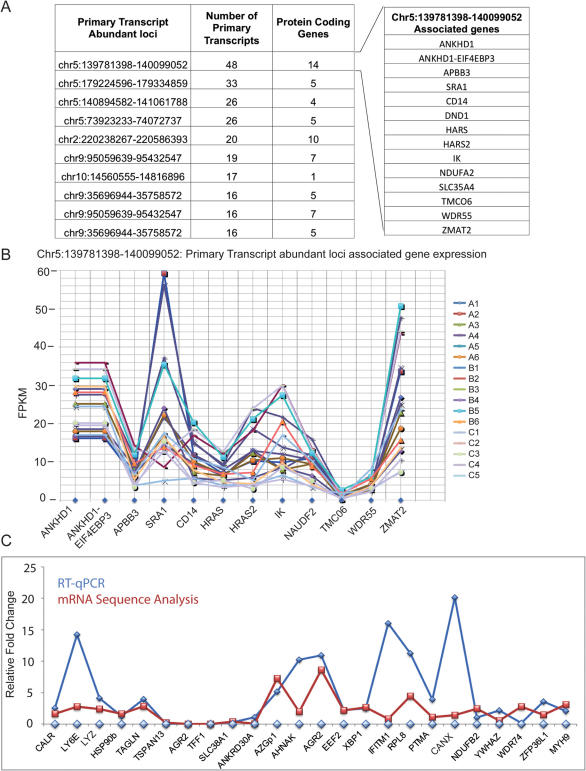
Breast cancer is a heterogeneous disease with a poorly defined genetic landscape, which poses a major challenge in diagnosis and treatment. By massively parallel mRNA sequencing, we obtained 1.2 billion reads from 17 individual human tissues belonging to TNBC, Non-TNBC, and HER2-positive breast cancers and defined their comprehensive digital transcriptome for the first time. Surprisingly, we identified a high number of novel and unannotated transcripts, revealing the global breast cancer transcriptomic adaptations. Comparative transcriptomic analyses elucidated differentially expressed transcripts between the three breast cancer groups, identifying several new modulators of breast cancer. Our study also identified common transcriptional regulatory elements, such as highly abundant primary transcripts, including osteonectin, RACK1, calnexin, calreticulin, FTL, and B2M, and "genomic hotspots" enriched in primary transcripts between the three groups. Thus, our study opens previously unexplored niches that could enable a better understanding of the disease and the development of potential intervention strategies.


Figures

Figure 1
Figure 1. The comparative transcriptomic profiling of TNBC, Non-TNBC and HER2-positive breast cancer mRNA sequencing.
(A) Overview of the steps involved in the mRNA sequencing analysis of TNBC, Non-TNBC and HER2-positive breast cancers. (B) The mRNA reads were mapped to the Ensembl GRCh37.62 B human genome (hg19), and the summary of the alignment statistics of the fragments mapping onto the reference genome is presented in different colours. (C) The distribution of the fragments onto the Ensembl GRCh37.62 B human genome (hg19) is shown as the percentage of reads that map onto exons, introns, intergenic regions and junctions. (D) The total number of exons assembled from the aligned reads in each sample.
Figure 2
Figure 2. The overall transcriptomic expression profile of TNBC, non-TNBC and HER2-positive breast cancers and correlation between the breast cancers.
(A) The transcriptomic expression profiles are shown in the Circos plot. The expression profile of the transcripts with FPKM (i.e., the transcript abundance measured by cufflinks using Ensembl GRCh37.62 B human genome (hg19)) of up to 200 in all six samples of the three breast cancer types was visualised in Circos for the (C) TNBC, (D) Non-TNBC (ER/PR and HER2-positive) and (E) HER2-positive (ER/PR negative) breast cancer types. The expression profile of each sample is represented as a single circle, and the FPKM of the individual transcripts are depicted as peaks. The order of the transcript expression profile samples is from the inner circle to the outside, as depicted by the direction of the arrow and the labels. The total number of transcripts (above FPKM 0.01) in each sample is provided in brackets next to the sample label. The abundance of an individual transcript is depicted as a peak. The expression of transcripts in several genomic loci appears similar; however, individual variations are evident at specific loci within each group. (B) The relative transcript abundance, calculated from the commonly (only transcripts expressed in all 17 samples) expressed transcripts in the three groups, shows that TNBC expressed a higher abundance of transcripts on chromosome 6. (C) PCA plots showing the clustering of the TNBC (magenta), Non-TNBC (Red) and HER2-positive (green) breast cancer samples based on the transcriptomic expression profiles. (D) The heat map of the pairwise correlation between all of the samples based on the Spearman correlation coefficient, which ranks and quantifies the degree of similarity between each pair of samples.
Figure 3
Figure 3. Differential transcript expression between TNBC, Non-TNBC and HER2-positive cancers.
(A) The number of statistically significant differentially expressed transcripts identified from the F-test. Volcano plots show the differential expression of the statistically significant transcripts (p value less than 0.05 and FDR 0.05) between (B) TNBC vs. Non-TNBC (C) TNBC vs. HER2-positive and (D) Non-TNBC vs. HER2 positive pairwise comparisons. The Circos plots show statistically significant differences in transcript expression from the above univariate F-test between (E) TNBC vs. Non-TNBC (F) TNBC vs. HER2-positive and (G) Non-TNBC vs. HER2- positive breast cancers. The top hundred transcripts as determined by the p-value are labelled on the Circos plot. The stacked histograms represent the abundance (FPKM) associated with each sample for that specific differentially expressed transcript. The TNBC group samples A1 to A6 are coloured in red, orange, yellow, green blue and purple. The Non-TNBC group samples B1 to B6 are coloured in red, blue, green, purple, orange, yellow and the HER2-positive group samples C1 to C6 are coloured in green, orange, blue, magenta, sea green, and yellow.
Figure 4
Figure 4. The top five highly abundant primary transcripts are common in all three breast cancers.
The transcript expression profiles of all expressed isoforms of (A) the Progesterone receptor, (B) the Oestrogen receptor and (C) the Human epidermal growth factor receptor 2 in all 17 samples. (D) The table presents the six most common highly abundant primary transcripts and all of the associated information derived from the cuffdiff and cufflinks analyses. The bottom four lines of the table show the primary transcript expression profiles specific for the TNBC and Non-TNBC (APOE) and HER2-positive (FN1, PP1B and OAZ1) groups. However, the primary transcript abundance of FN1, PP1B and OAZ1 indicates that they are among the ten most highly expressed primary transcripts within each group. (E) The exon model of all of the nine isoforms that belong to SPARC. The exons are shown as coloured blocks, and the introns are shown as dotted lines. (F) The broken pie chart shown in the middle represents the relative abundance of the SPARC primary transcript groups in the TNBC (inner circle), Non-TNBC (the middle circle) and HER2-positive (the outer circle) breast cancer groups. The five commonly expressed SPARC primary transcripts are labelled as TSS1 to TSS5. Their relative abundances are represented by different colours, and the relative expression levels as percentages are indicated on the circle. The expression of specific isoforms and the changes in abundance are indicated for primary transcript groups II and III. The lime (on the top left) and salmon (bottom right) coloured arrows point to the isoforms that originate from the TSSII and TSSIII primary transcripts, respectively. The relative abundances of isoforms that belong to TSSII and TSSIII in TNBC, Non-TNBC and HER2-positive cancers are presented as pie chart in shades of colours similar to their primary transcripts. The bar chart shows the abundance of the all of the SPARC isoforms estimated by cufflinks.
Figure 5
Figure 5. The “genomic hotspots”, the highly spliced loci in all three cancers are conserved, and experimental validation by RT-qPCR confirms the accuracy of the analysis.
(A) The genomic loci that comprise the highest numbers of primary transcripts in TNBC, Non-TNBC and HER2-positive breast cancers, along with the number of primary transcripts identified from these loci and the number of genes encoded in all seventeen samples, are presented in a table. The separate panel shows the genes associated with genomic loci chr5:139781398–140099052, which encodes the largest number of genes in all three breast cancers. (B) The abundance of genes (FPKM) that belong to genomic loci chr5:139781398–140099052 was estimated by cufflinks in all 17 samples. (C) A comparison of the RT-qPCR and RNA sequence expression analysis. The isoforms differentially expressed at statistically significant levels were selected randomly from the TNBC vs. Non-TNBC, TNBC vs. HER2-positive and Non-TNBC vs. HER2-positive pairwise comparisons. RT-qPCR of the isoforms in all of the samples from the pairwise comparisons was performed. The average fold change was calculated from the mean of the experimentally calculated mRNA levels of the isoform within one group divided by the levels in the other. Supporting Document S23 presents the individual RT-qPCR validation bar chart for each isoform in all of the tested samples. For the RNA sequencing analysis, the average fold change was calculated from the mean FPKM of the isoform in all samples in one group divided by the mean FPKM of the other.

References

    1. Jemal A. et al. Global cancer statistics. CA Cancer J Clin 61, 69–90 (2011). - PubMed
    1. Vargo-Gogola T. & Rosen J. M. Modelling breast cancer: one size does not fit all. Nat Rev Cancer 7, 659–672 (2007). - PubMed
    1. Reis-Filho J. S. & Lakhani S. R. Breast cancer special types: why bother? J Pathol 216, 394–398 (2008). - PubMed
    1. Geyer F. C., Marchio C. & Reis-Filho J. S. The role of molecular analysis in breast cancer. Pathology 41, 77–88 (2009). - PubMed
    1. Weigelt B. & Reis-Filho J. S. Histological and molecular types of breast cancer: is there a unifying taxonomy? Nat Rev Clin Oncol 6, 718–730 (2009). - PubMed

Publication types