. 2012:2:281.
doi: 10.1038/srep00281. Epub 2012 Feb 21.

Growth dynamics and the evolution of cooperation in microbial populations

Affiliations

Growth dynamics and the evolution of cooperation in microbial populations

Jonas Cremer et al. Sci Rep. 2012.

Abstract

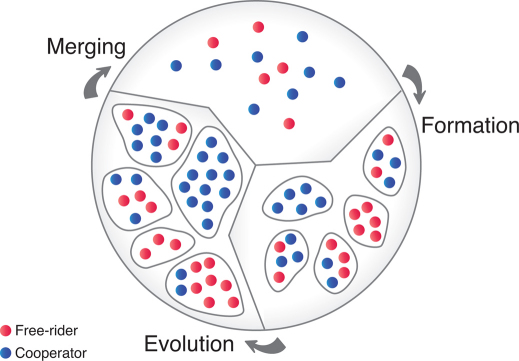
Microbes providing public goods are widespread in nature despite running the risk of being exploited by free-riders. However, the precise ecological factors supporting cooperation are still puzzling. Following recent experiments, we consider the role of population growth and the repetitive fragmentation of populations into new colonies mimicking simple microbial life-cycles. Individual-based modeling reveals that demographic fluctuations, which lead to a large variance in the composition of colonies, promote cooperation. Biased by population dynamics these fluctuations result in two qualitatively distinct regimes of robust cooperation under repetitive fragmentation into groups. First, if the level of cooperation exceeds a threshold, cooperators will take over the whole population. Second, cooperators can also emerge from a single mutant leading to a robust coexistence between cooperators and free-riders. We find frequency and size of population bottlenecks, and growth dynamics to be the major ecological factors determining the regimes and thereby the evolutionary pathway towards cooperation.


Figures

Figure 1
Figure 1. Repetitive cycle of population dynamics.
The time evolution of a population composed of cooperators (blue) and free-riders (red) consists of three cyclically recurring steps. Group formation step: we consider a well-mixed population which is divided into M separate groups (i = 1, …, M) by an unbiased stochastic process such that the initial group size and the fraction of cooperation vary statistically with mean values n0 and x0, respectively. Group evolution step: groups grow and evolve separately and independently; while the fraction of cooperators decrease within each group, cooperative groups grow faster and can reach a higher carrying capacity. Group merging step: after a regrouping time, T, all groups are merged together again. With the ensuing new composition of the total population, the cycle starts anew.
Figure 2
Figure 2. Evolution while individuals are arranged in groups (group-evolution step).
(A) Population average of cooperator fraction, x, as a function of time t. Depending on the average initial group size, n0, three different scenarios arise: decrease of cooperation (red line, n0 = 30), transient increase of cooperation (green line, n0 = 6, increase until cooperation time tc) and permanently enhanced cooperation (blue line, n0 = 4). These three scenarios arise from the interplay of two mechanisms. While the group-growth mechanism, due to faster growth of more cooperative groups, can cause a maximum in the fraction of cooperators for short times, the group-fixation mechanism, due to a larger maximum size of purely cooperative groups, assures cooperation for large times. Both mechanisms become less efficient with increasing initial group sizes and are not effective in the deterministic limit (dashed black line, solution of Eq. (S7) for N0 = 6) as the rely on fluctuations. (B) The strength of the group-growth mechanism decreases with an increasing initial fraction of cooperators. This is illustrated by comparing the time evolution for three different initial fractions of cooperators and a fixed initial group size n0 = 5. After a fixed time, here t = 3.03, the fraction of cooperators is larger than the initial one for x0 = 0.2, equal to it for x0 = 0.5, and eventually becomes smaller than the initial value, as shown for x0 = 0.8. (C) Change of the average group size, n = Σivi /M. At the beginning the groups grow exponentially, while they later saturate to their maximum group size. As this maximum size depends on the fraction of cooperators, the average group size declines with the loss in the level of cooperation (n0 = 6, green line). The deterministic solution for the same set of parameters which does not account for fluctuations (dashed black line, solution of Eq. (S7)) describes this behavior qualitatively. s = 0.1, p = 10.
Figure 3
Figure 3. Evolution of the overall cooperator fraction under repeated regrouping.
After many iterations, k, of the evolutionary cycle, a stationary level of cooperation is reached. (A) For small population bottlenecks, n0 ≤ 3, group-growth and group-fixation mechanisms are effective and lead to purely cooperative populations. Growth parameters, bottleneck size and the regrouping time are chosen according to the experiments by Chuang et al., see supplementary information. Without any fitting parameters, our simulation results (colored lines) are in good agreement with the experimental data (black points). (B) For larger bottlenecks, n0 = 5, and depending on the relative efficiency of the group-growth and group-fixation mechanism, two qualitatively different regimes can be distinguished. While the group-growth mechanism leads to stable coexistence of cooperators and free-riders (green lines), the group-fixation mechanism can lead to a pure state of either only cheaters (red line) or only cooperators (blue line). The relative impact of these mechanisms depends strongly on the regrouping time T. For short regrouping times (Tshort = 2.5 < ts, green lines), the group-growth mechanism is effective, while for sufficiently long regrouping times (Tlong = 20 > ts, blue and red lines) the group-fixation mechanism acts more strongly. (C) With parameters equal to (B), the detailed interplay of the group-growth and group-fixation mechanisms is summarized in a bifurcation diagram showing the stationary levels of cooperation as a function of the regrouping time T. Depending of the relative efficiency of both mechanism, four different regimes arise: pure cooperation, coexistence, intermediate, and bistability. The times Tshort and Tlong correspond to the green and red/blue lines shown in (B). Parameters are x0 = 0.086, T = 3.1, s = 0.05 and p = 6.6 in (A); see also supplementary information. In (B), x0 = {0.1 (green), x0 = 0.9 (green)} and x0 = {0.5 (red), x0 = 0.6 (blue)} for Tshort = 2.5 and Tlong = 20, respectively. s = 0.1 and p = 10 in (B/C).

References

    1. Hamilton W. D. The genetical evolution of social behaviour. I+II. J. Theor. Biol. 7, 1–52 (1964). - PubMed
    1. Axelrod R. & Hamilton W. The evolution of cooperation. Science 211, 1390–1396 (1981). - PubMed
    1. Maynard-Smith J. & Szathmary E. The Major Transitions in Evolution (Oxford University Press, Oxford, 1995).
    1. Frank S. A. Foundations of Social Evolution (Princeton University Press, 1998).
    1. Nowak M. A. Five rules for the evolution of cooperation. Science 314, 1560–1563 (2006). - PMC - PubMed

Publication types