

Toward an electrocortical biomarker of cognition for newborn infants
- PMID: 22356181
- PMCID: PMC3292196
- DOI: 10.1111/j.1467-7687.2011.01122.x
Toward an electrocortical biomarker of cognition for newborn infants
Abstract
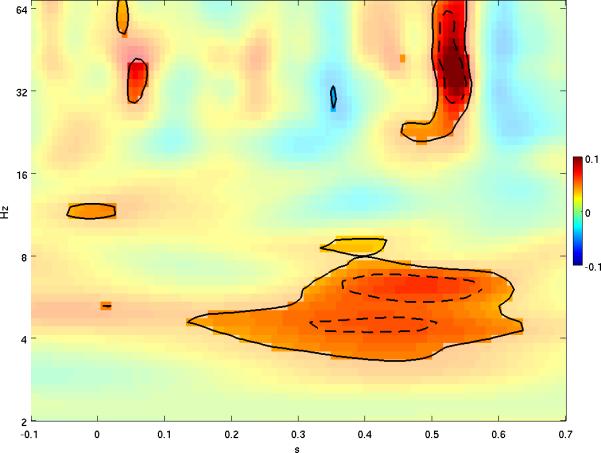
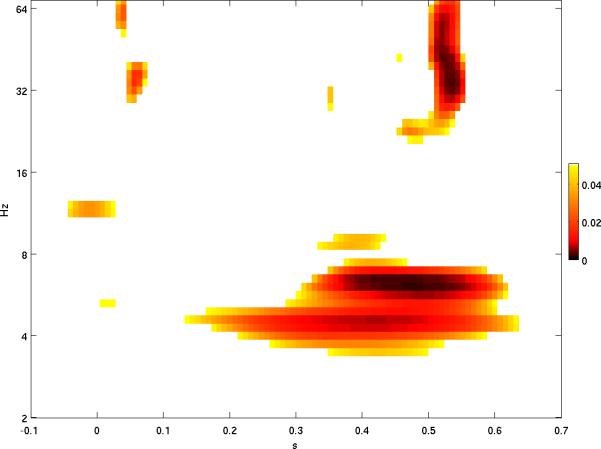
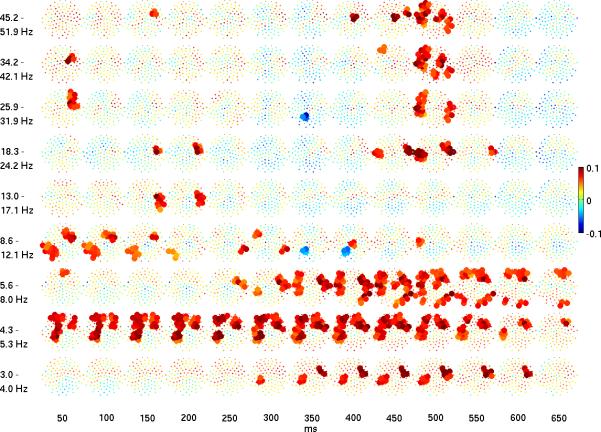
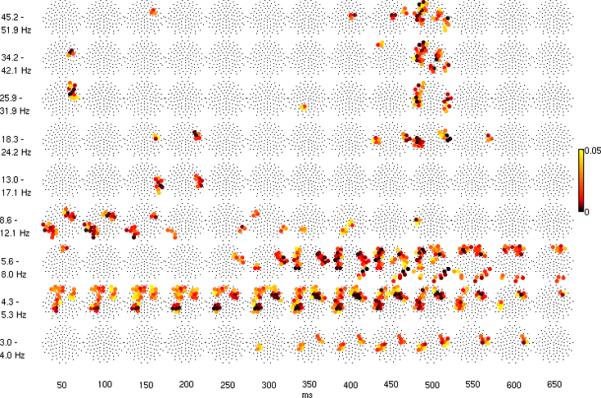
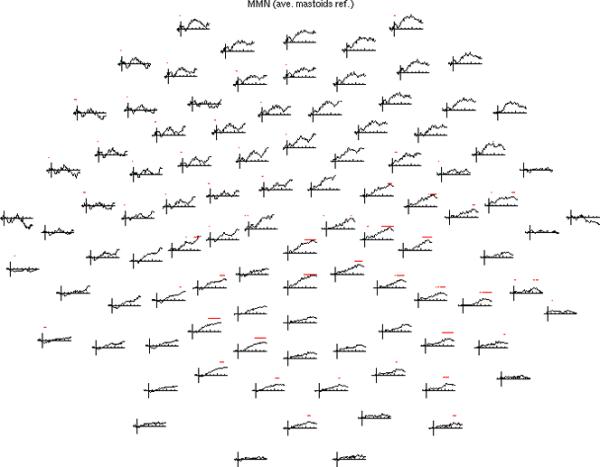
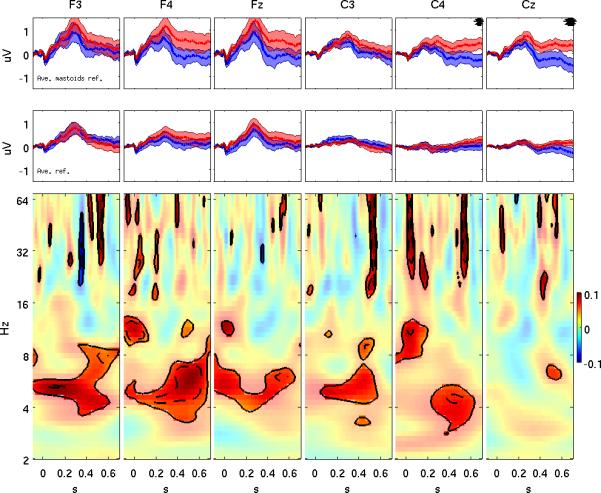
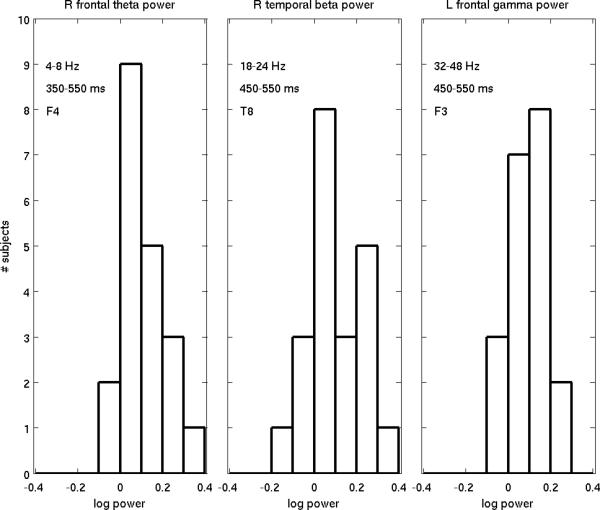
The event-related potential (ERP) effect of mismatch negativity (MMN) was the first electrophysiological probe to evaluate cognitive processing (change detection) in newborn infants. Initial studies of MMN predicted clinical utility for this measure in identification of infants at risk for developmental cognitive deficits. These predictions have not been realized. We hypothesized that in sleeping newborn infants, measures derived from wavelet assessment of power in the MMN paradigm would be more robust markers of the brain's response to stimulus change than the ERP-derived MMN. Consistent with this premise, we found increased power in response to unpredictable and infrequent tones compared to frequent tones. These increases were present at multiple locations on the scalp over a range of latencies and frequencies and occurred even in the absence of an ERP-derived MMN. There were two predominant effects. First, theta band power was elevated at middle and late latencies (200 to 600 ms), suggesting that neocortical theta rhythms that subserve working memory in adults are present at birth. Second, late latency (500 ms) increased power to the unpredictable and infrequent tones was observed in the beta and gamma bands, suggesting that oscillations involved in adult cognition are also present in the neonate. These findings support the expectation that frequency dependent measures, such as wavelet power, will improve the prospects for a clinically useful test of cortical function early in the postnatal period.
© 2011 Blackwell Publishing Ltd.
Figures
Similar articles
-
Maturational effects on newborn ERPs measured in the mismatch negativity paradigm.Exp Neurol. 2004 Nov;190 Suppl 1:S91-101. doi: 10.1016/j.expneurol.2004.06.002. Exp Neurol. 2004. PMID: 15498547 Clinical Trial.
-
NMDA Receptor Antagonist Effects on Speech-Related Mismatch Negativity and Its Underlying Oscillatory and Source Activity in Healthy Humans.Front Pharmacol. 2019 May 8;10:455. doi: 10.3389/fphar.2019.00455. eCollection 2019. Front Pharmacol. 2019. PMID: 31139075 Free PMC article.
-
Neural substrates of normal and impaired preattentive sensory discrimination in large cohorts of nonpsychiatric subjects and schizophrenia patients as indexed by MMN and P3a change detection responses.Neuroimage. 2013 Feb 1;66:594-603. doi: 10.1016/j.neuroimage.2012.09.074. Epub 2012 Oct 22. Neuroimage. 2013. PMID: 23085112 Free PMC article.
-
Mismatch negativity (MMN) as a tool for investigating auditory discrimination and sensory memory in infants and children.Clin Neurophysiol. 2000 Jan;111(1):4-16. doi: 10.1016/s1388-2457(99)00191-1. Clin Neurophysiol. 2000. PMID: 10656505 Review.
-
Neonatal Monitoring: Prediction of Autonomic Regulation at 1 Month from Newborn Assessments.In: Duncan JR, Byard RW, editors. SIDS Sudden Infant and Early Childhood Death: The Past, the Present and the Future. Adelaide (AU): University of Adelaide Press; 2018 May. Chapter 21. In: Duncan JR, Byard RW, editors. SIDS Sudden Infant and Early Childhood Death: The Past, the Present and the Future. Adelaide (AU): University of Adelaide Press; 2018 May. Chapter 21. PMID: 30035942 Free Books & Documents. Review.
Cited by
-
Development of auditory change-detection and attentional capture, and their relation to inhibitory control.Psychophysiology. 2023 Apr;60(4):e14211. doi: 10.1111/psyp.14211. Epub 2022 Nov 9. Psychophysiology. 2023. PMID: 36350009 Free PMC article.
-
A graphical user interface for infant ERP analysis.Behav Res Methods. 2014 Sep;46(3):745-57. doi: 10.3758/s13428-013-0404-4. Behav Res Methods. 2014. PMID: 24264591 Free PMC article.
-
Impact of brain overgrowth on sensorial learning processing during the first year of life.Front Hum Neurosci. 2022 Jul 19;16:928543. doi: 10.3389/fnhum.2022.928543. eCollection 2022. Front Hum Neurosci. 2022. PMID: 35927999 Free PMC article.
-
Spectral-temporal EEG dynamics of speech discrimination processing in infants during sleep.BMC Neurosci. 2017 Mar 22;18(1):34. doi: 10.1186/s12868-017-0353-4. BMC Neurosci. 2017. PMID: 28330464 Free PMC article.
-
Reduced left-lateralized pattern of event-related EEG oscillations in infants at familial risk for language and learning impairment.Neuroimage Clin. 2019;22:101778. doi: 10.1016/j.nicl.2019.101778. Epub 2019 Mar 12. Neuroimage Clin. 2019. PMID: 30901712 Free PMC article.
References
-
- Alho K, Huotilainen M, Naatanen R. Are memory traces for simple and complex sounds located in different regions of auditory cortex? Recent MEG studies. Electroencephalogr Clin Neurophysiol Suppl. 1995;44:197–203. - PubMed
-
- Alho K, Sainio K, Sajaniemi N, Reinikainen K, Naatanen R. Event-related brain potential of human newborns to pitch change of an acoustic stimulus. Electroencephalogr Clin Neurophysiol. 1990;77(2):151–155. - PubMed
-
- Bishop DV. Using mismatch negativity to study central auditory processing in developmental language and literacy impairments: where are we, and where should we be going? Psychol Bull. 2007;133(4):651–672. - PubMed
-
- Buschman TJ, Miller EK. Top-down versus bottom-up control of attention in the prefrontal and posterior parietal cortices. Science. 2007;315(5820):1860–1862. - PubMed
Publication types
MeSH terms
Substances
Grants and funding
LinkOut - more resources
Full Text Sources
