

Mechanical buckling of artery under pulsatile pressure
- PMID: 22356844
- PMCID: PMC3327784
- DOI: 10.1016/j.jbiomech.2012.01.035
Mechanical buckling of artery under pulsatile pressure
Abstract
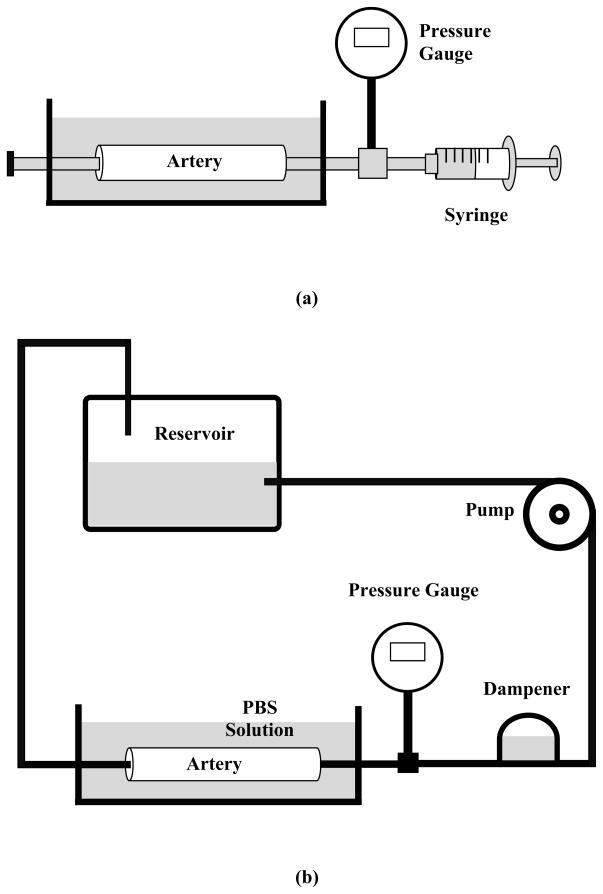
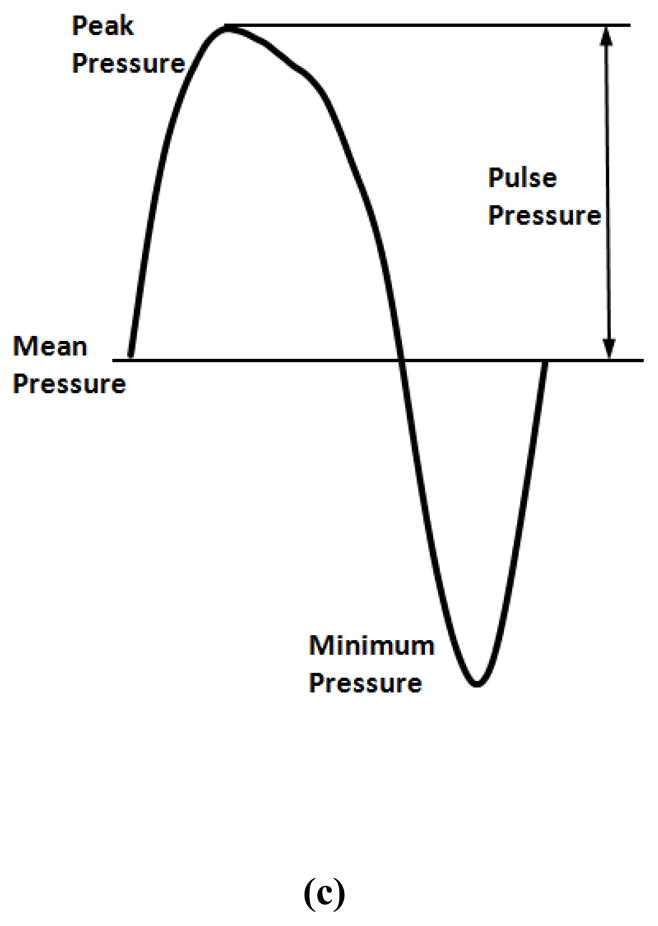
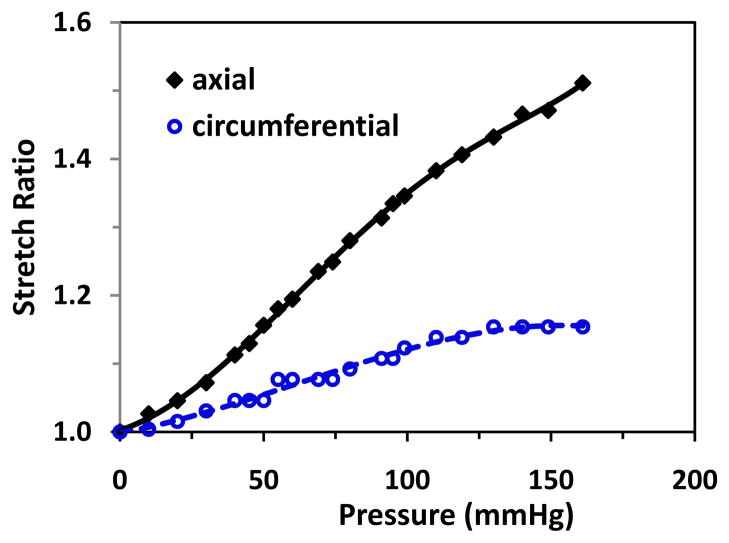
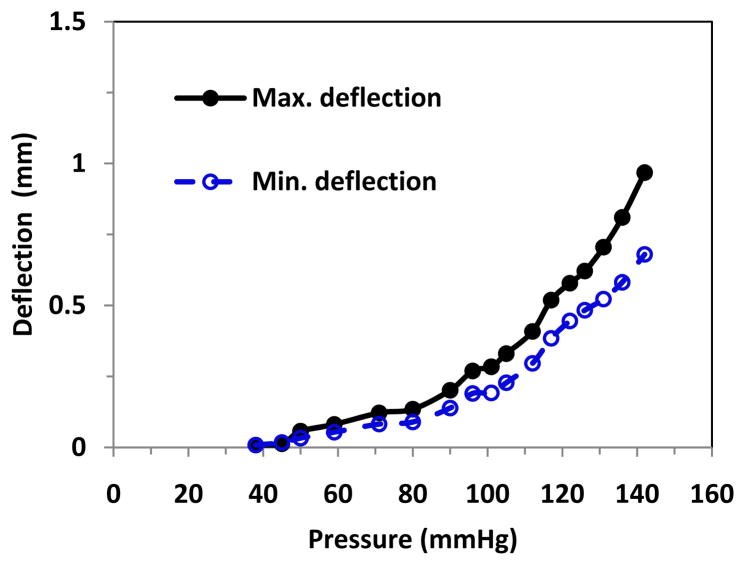
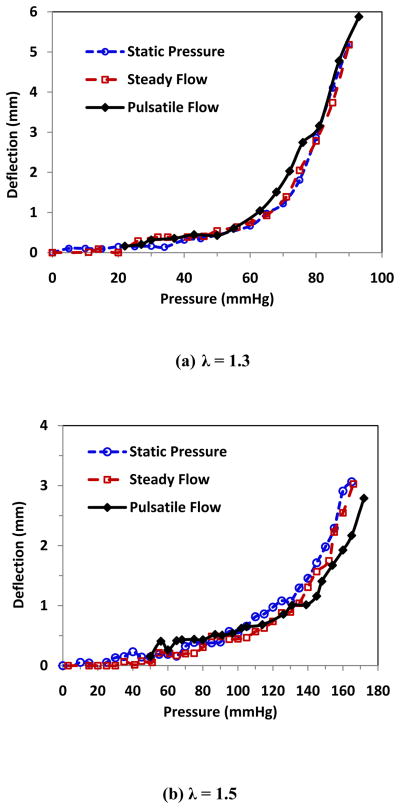
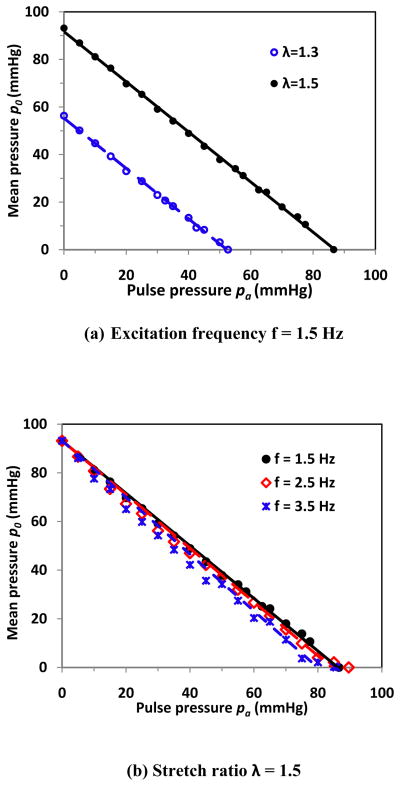
Tortuosity that often occurs in carotid and other arteries has been shown to be associated with high blood pressure, atherosclerosis, and other diseases. However the mechanisms of tortuosity development are not clear. Our previous studies have suggested that arteries buckling could be a possible mechanism for the initiation of tortuous shape but artery buckling under pulsatile flow condition has not been fully studied. The objectives of this study were to determine the artery critical buckling pressure under pulsatile pressure both experimentally and theoretically, and to elucidate the relationship of critical pressures under pulsatile flow, steady flow, and static pressure. We first tested the buckling pressures of porcine carotid arteries under these loading conditions, and then proposed a nonlinear elastic artery model to examine the buckling pressures under pulsatile pressure conditions. Experimental results showed that under pulsatile pressure arteries buckled when the peak pressures were approximately equal to the critical buckling pressures under static pressure. This was also confirmed by model simulations at low pulse frequencies. Our results provide an effective tool to predict artery buckling pressure under pulsatile pressure.
Copyright © 2012 Elsevier Ltd. All rights reserved.
Conflict of interest statement
The authors have no conflict of interest.
Figures
References
-
- Amemiya T, I, Bhutto A. Retinal vascular changes and systemic diseases: corrosion cast demonstration. Ital J Anat Embryol. 2001;106(2 Suppl 1):237–44. - PubMed
-
- Ballotta E, Thiene G, Baracchini C, Ermani M, Militello C, Da Giau G, Barbon B, Angelini A. Surgical vs medical treatment for isolated internal carotid artery elongation with coiling or kinking in symptomatic patients: a prospective randomized clinical study. J Vasc Surg. 2005;42(5):838–46. discussion 846. - PubMed
-
- Bazant ZP, Cedolin L. Stability of Structures: Elastic, Inelastic, Fracture, and Damage Theories. Mineola, NY: Dover Publications, Inc; 2003.
-
- Cheung AT, Ramanujam S, Greer DA, Kumagai LF, Aoki TT. Microvascular abnormalities in the bulbar conjunctiva of patients with type 2 diabetes mellitus. Endocr Pract. 2001;7(5):358–63. - PubMed
Publication types
MeSH terms
Grants and funding
LinkOut - more resources
Full Text Sources
