

Protein-based identification of quantitative trait loci associated with malignant transformation in two HER2+ cellular models of breast cancer
- PMID: 22357162
- PMCID: PMC3305585
- DOI: 10.1186/1477-5956-10-11
Protein-based identification of quantitative trait loci associated with malignant transformation in two HER2+ cellular models of breast cancer
Abstract
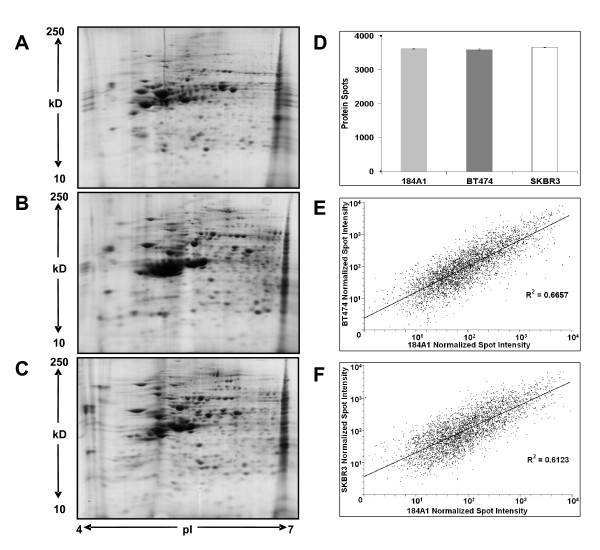
Background: A contemporary view of the cancer genome reveals extensive rearrangement compared to normal cells. Yet how these genetic alterations translate into specific proteomic changes that underpin acquiring the hallmarks of cancer remains unresolved. The objectives of this study were to quantify alterations in protein expression in two HER2+ cellular models of breast cancer and to infer differentially regulated signaling pathways in these models associated with the hallmarks of cancer.
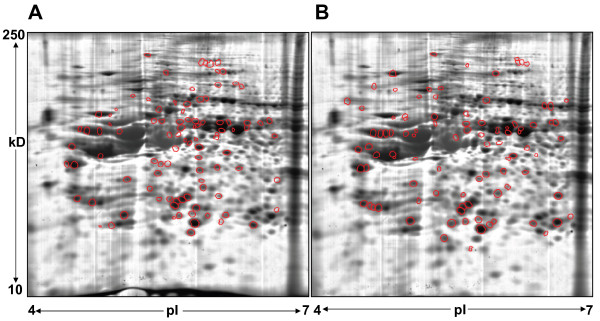
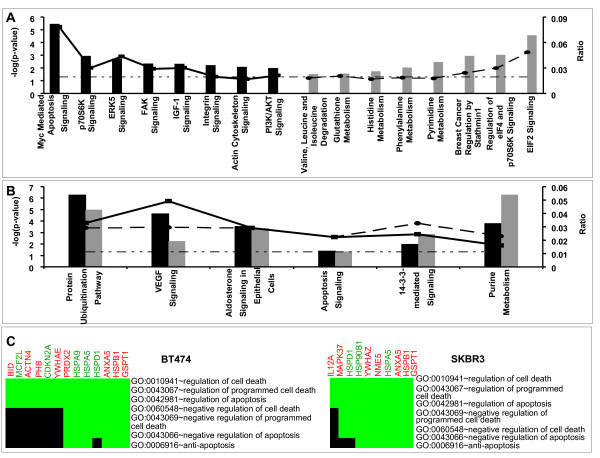
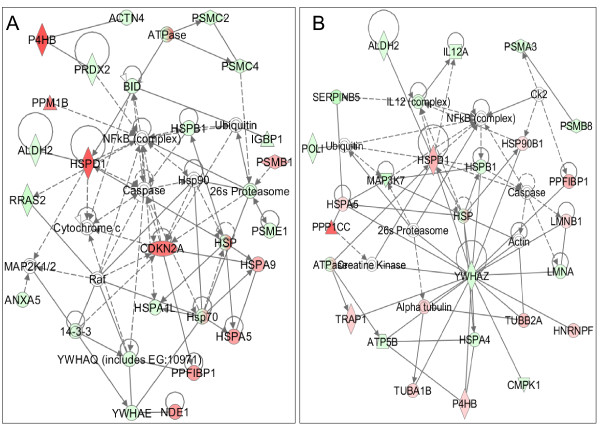
Results: A proteomic workflow was used to identify proteins in two HER2 positive tumorigenic cell lines (BT474 and SKBR3) that were differentially expressed relative to a normal human mammary epithelial cell line (184A1). A total of 64 (BT474-184A1) and 69 (SKBR3-184A1) proteins were uniquely identified that were differentially expressed by at least 1.5-fold. Pathway inference tools were used to interpret these proteins in terms of functionally enriched pathways in the tumor cell lines. We observed "protein ubiquitination" and "apoptosis signaling" pathways were both enriched in the two breast cancer models while "IGF signaling" and "cell motility" pathways were enriched in BT474 and "amino acid metabolism" were enriched in the SKBR3 cell line.
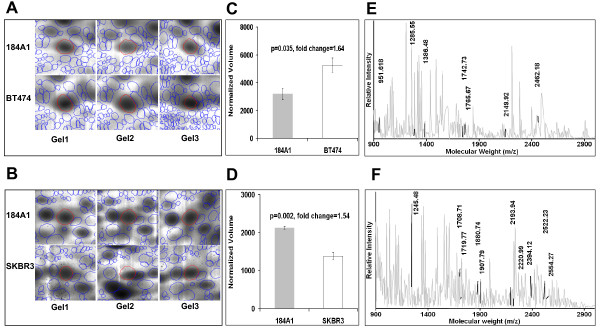
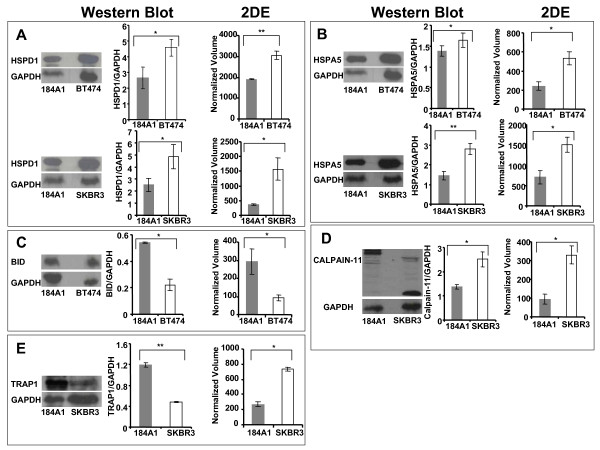
Conclusion: While "protein ubiquitination" and "apoptosis signaling" pathways were common to both the cell lines, the observed patterns of protein expression suggest that the evasion of apoptosis in each tumorigenic cell line occurs via different mechanisms. Evidently, apoptosis is regulated in BT474 via down regulation of Bid and in SKBR3 via up regulation of Calpain-11 as compared to 184A1.
Figures
Similar articles
-
Inferring alterations in cell-to-cell communication in HER2+ breast cancer using secretome profiling of three cell models.Biotechnol Bioeng. 2014 Sep;111(9):1853-63. doi: 10.1002/bit.25238. Epub 2014 Apr 18. Biotechnol Bioeng. 2014. PMID: 24752654 Free PMC article.
-
Inferring predominant pathways in cellular models of breast cancer using limited sample proteomic profiling.BMC Cancer. 2010 Jun 15;10:291. doi: 10.1186/1471-2407-10-291. BMC Cancer. 2010. PMID: 20550684 Free PMC article.
-
Palmitate-induced ER stress increases trastuzumab sensitivity in HER2/neu-positive breast cancer cells.BMC Cancer. 2016 Jul 27;16:551. doi: 10.1186/s12885-016-2611-8. BMC Cancer. 2016. PMID: 27464732 Free PMC article.
-
Erythropoietin receptor expression and its relationship with trastuzumab response and resistance in HER2-positive breast cancer cells.Breast Cancer Res Treat. 2012 Dec;136(3):739-48. doi: 10.1007/s10549-012-2316-x. Epub 2012 Nov 2. Breast Cancer Res Treat. 2012. PMID: 23117856
-
MRNA stability and overexpression of fatty acid synthase in human breast cancer cell lines.Anticancer Res. 2007 Jan-Feb;27(1A):27-34. Anticancer Res. 2007. PMID: 17352212
Cited by
-
Inferring alterations in cell-to-cell communication in HER2+ breast cancer using secretome profiling of three cell models.Biotechnol Bioeng. 2014 Sep;111(9):1853-63. doi: 10.1002/bit.25238. Epub 2014 Apr 18. Biotechnol Bioeng. 2014. PMID: 24752654 Free PMC article.
-
Exosomes: improved methods to characterize their morphology, RNA content, and surface protein biomarkers.Analyst. 2015 Oct 7;140(19):6631-42. doi: 10.1039/c5an00688k. Analyst. 2015. PMID: 26332016 Free PMC article.
-
Identification of four differentially methylated genes as prognostic signatures for stage I lung adenocarcinoma.Cancer Cell Int. 2018 Apr 19;18:60. doi: 10.1186/s12935-018-0547-6. eCollection 2018. Cancer Cell Int. 2018. PMID: 29713243 Free PMC article.
-
Induction of Wnt-inducible signaling protein-1 correlates with invasive breast cancer oncogenesis and reduced type 1 cell-mediated cytotoxic immunity: a retrospective study.PLoS Comput Biol. 2014 Jan;10(1):e1003409. doi: 10.1371/journal.pcbi.1003409. Epub 2014 Jan 9. PLoS Comput Biol. 2014. PMID: 24426833 Free PMC article.
References
-
- Stephens PJ, McBride DJ, Lin ML, Varela I, Pleasance ED, Simpson JT, Stebbings LA, Leroy C, Edkins S, Mudie LJ, Greenman CD, Jia M, Latimer C, Teague JW, Lau KW, Burton J, Quail MA, Swerdlow H, Churcher C, Natrajan R, Sieuwerts AM, Martens JW, Silver DP, Langerod A, Russnes HE, Foekens JA, Reis-Filho JS, van V, Richardson AL, Borresen-Dale AL, Campbell PJ, Futreal PA, Stratton MR. Complex landscapes of somatic rearrangement in human breast cancer genomes. Nature. 2009;462:1005–1010. doi: 10.1038/nature08645. - DOI - PMC - PubMed
-
- Greenman C, Stephens P, Smith R, Dalgliesh GL, Hunter C, Bignell G, Davies H, Teague J, Butler A, Stevens C, Edkins S, O'Meara S, Vastrik I, Schmidt EE, Avis T, Barthorpe S, Bhamra G, Buck G, Choudhury B, Clements J, Cole J, Dicks E, Forbes S, Gray K, Halliday K, Harrison R, Hills K, Hinton J, Jenkinson A, Jones D, Menzies A, Mironenko T, Perry J, Raine K, Richardson D, Shepherd R, Small A, Tofts C, Varian J, Webb T, West S, Widaa S, Yates A, Cahill DP, Louis DN, Goldstraw P, Nicholson AG, Brasseur F, Looijenga L, Weber BL, Chiew YE, DeFazio A, Greaves MF, Green AR, Campbell P, Birney E, Easton DF, Chenevix-Trench G, Tan MH, Khoo SK, Teh BT, Yuen ST, Leung SY, Wooster R, Futreal PA, Stratton MR. Patterns of somatic mutation in human cancer genomes. Nature. 2007;446:153–158. doi: 10.1038/nature05610. - DOI - PMC - PubMed
Grants and funding
LinkOut - more resources
Full Text Sources
Research Materials
Miscellaneous
