. 2012 May;86(9):5000-13.
doi: 10.1128/JVI.07062-11. Epub 2012 Feb 22.

Vpu augments the initial burst phase of HIV-1 propagation and downregulates BST2 and CD4 in humanized mice

Affiliations

Vpu augments the initial burst phase of HIV-1 propagation and downregulates BST2 and CD4 in humanized mice

Kei Sato et al. J Virol. 2012 May.

Abstract

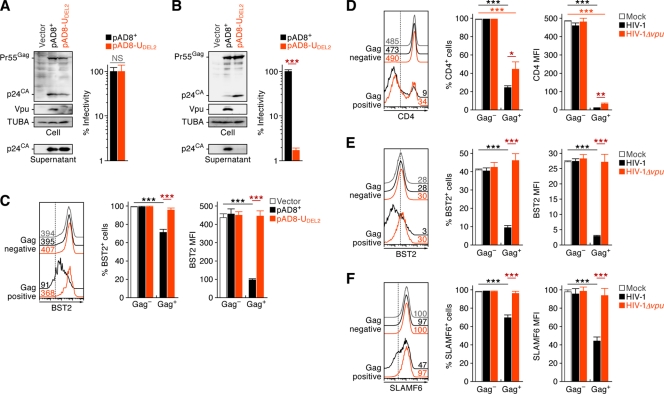
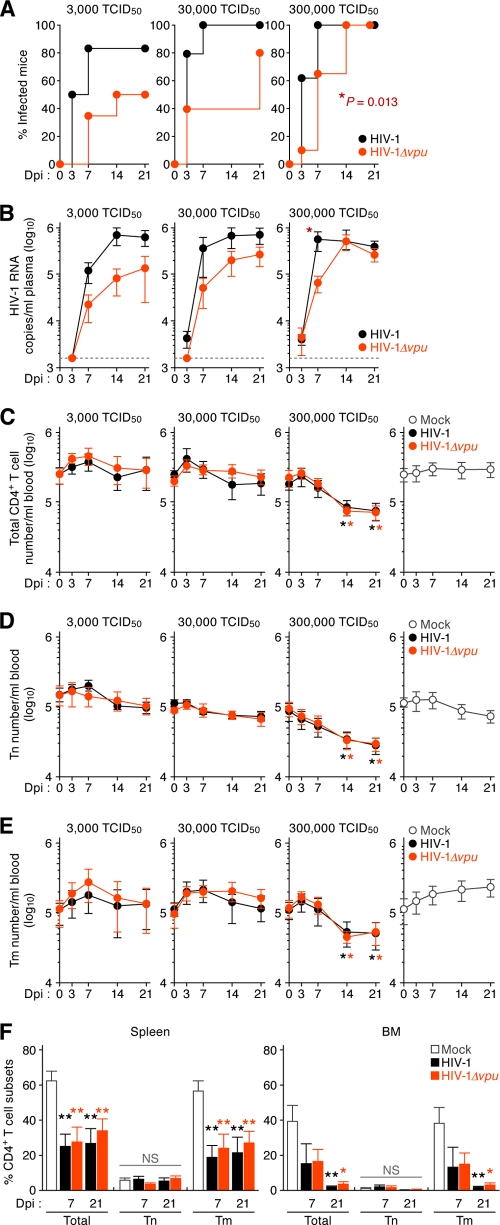
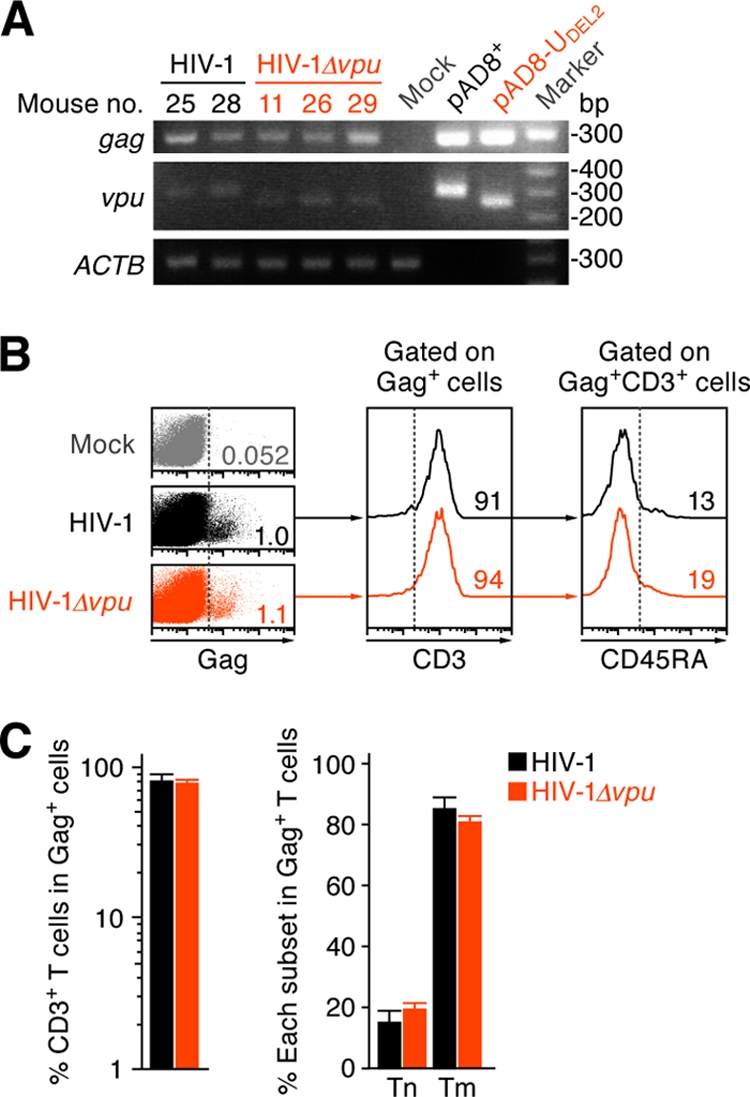
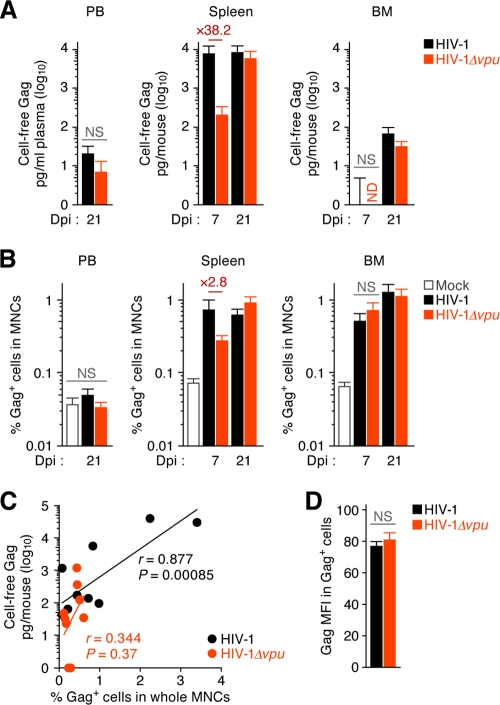
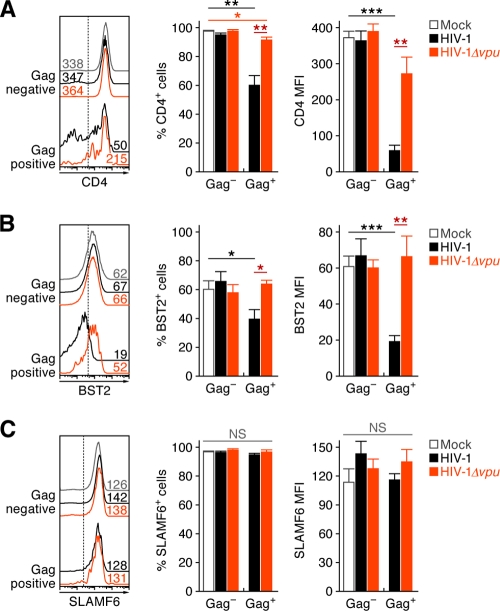
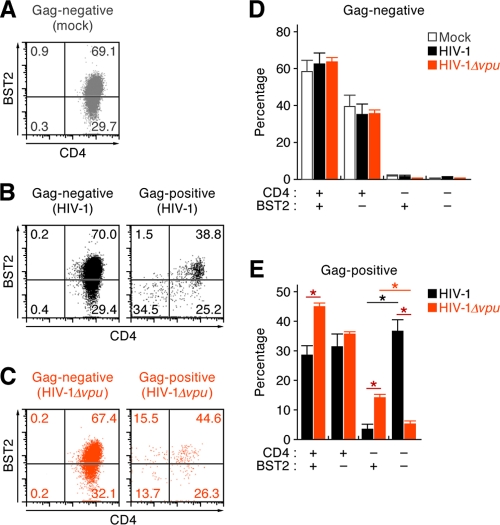
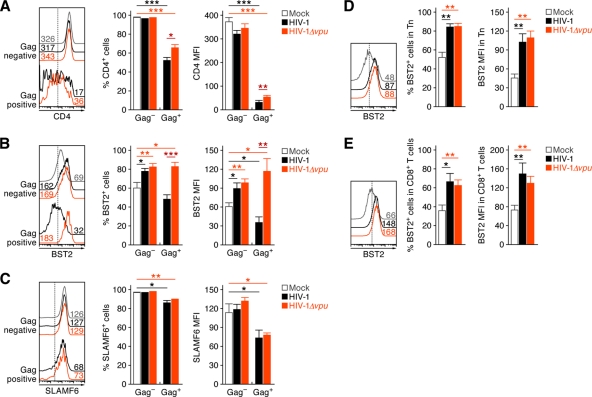
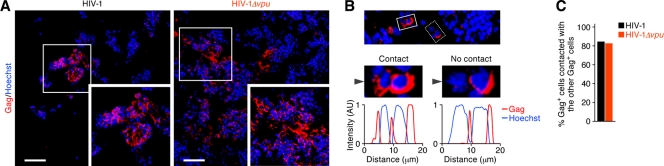
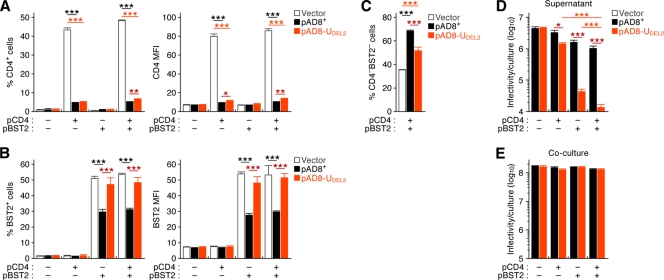
While human cells express potent antiviral proteins as part of the host defense repertoire, viruses have evolved their own arsenal of proteins to antagonize them. BST2 was identified as an inhibitory cellular protein of HIV-1 replication, which tethers virions to the cell surface to prevent their release. On the other hand, the HIV-1 accessory protein, Vpu, has the ability to downregulate and counteract BST2. Vpu also possesses the ability to downmodulate cellular CD4 and SLAMF6 molecules expressed on infected cells. However, the role of Vpu in HIV-1 infection in vivo remains unclear. Here, using a human hematopoietic stem cell-transplanted humanized mouse model, we demonstrate that Vpu contributes to the efficient spread of HIV-1 in vivo during the acute phase of infection. Although Vpu did not affect viral cytopathicity, target cell preference, and the level of viral protein expression, the amount of cell-free virions in vpu-deficient HIV-1-infected mice was profoundly lower than that in wild-type HIV-1-infected mice. We provide a novel insight suggesting that Vpu concomitantly downregulates BST2 and CD4, but not SLAMF6, from the surface of infected cells. Furthermore, we show evidence suggesting that BST2 and CD4 impair the production of cell-free infectious virions but do not associate with the efficiency of cell-to-cell HIV-1 transmission. Taken together, our findings suggest that Vpu downmodulates BST2 and CD4 in infected cells and augments the initial burst of HIV-1 replication in vivo. This is the first report demonstrating the role of Vpu in HIV-1 infection in an in vivo model.


Figures

Fig 1
Fig 1
Dynamics of WT and vpu-deficient HIV-1 infection in cultured cells. (A to C) HIV-1 release and downregulation of surface BST2. One microgram of pAD8+ (WT HIV-1-producing plasmid) or pAD8-UDEL2 (vpu-deficient HIV-1-producing plasmid) was transfected into 293T or HeLa cells, respectively. The expression levels of Gag (Pr55Gag) and Vpu, the amount of virions retained in the cells (p24CA in the cells), and the amount of released virion (p24CA in the supernatant) in the transfected 293T cells (A) and HeLa cells (B) were determined by Western blotting (left panels). The input of cell lysate was standardized to α-tubulin (TUBA), and representative results are shown. In TZM-bl assays titers of the viruses released from the transfected 293T cells and HeLa cells were determined. The infectivity is shown as the percentage of the value of WT HIV-1. (C) The surface expression level of BST2 on the transfected HeLa cells at 48 h posttransfection was assessed by flow cytometry. The HeLa cells transfected with pAD8+, pAD8-UDEL2, and pUC19 (parental plasmid; Vector) were classified into virus-producing (Gag-positive) or non-virus-producing (Gag-negative) populations by using an antibody against HIV-1 p24 antigen. Representative histograms (left), the percentage of BST2-positive cells (middle), and the MFI of BST2 (right) are shown. In the left panel, the numbers on each histogram indicate the MFI values, and the vertical broken lines indicate the thresholds for the gating of positive cells based on the result from the isotype control. The assay was performed in quadruplicate. (D to F) Primary human CD4+ T cells were prepared as described in Materials and Methods and infected with WT and vpu-deficient HIV-1 at an MOI of 0.1. At 7 dpi, the cells were harvested and used for flow cytometry. The cells were classified into infected (Gag-positive) or uninfected (Gag-negative) populations by using an anti-p24 antibody. Representative histograms (left), the positive percentages (middle), and the MFIs (right) of CD4, BST2, and SLAMF6 in each population are shown. In the left panels, the numbers on each histogram indicate the MFI values, and the vertical broken lines indicate the thresholds for the gating of positive cells based on the result from isotype controls. The assay was performed in triplicate. The statistic difference is determined by a Student's t test. Statistically significant differences are shown as follows: *, P < 0.05; **, P < 0.01; ***, P < 0.001. Error bars represent SEMs. NS, no statistical significance.
Fig 2
Fig 2
Dynamics of WT and vpu-deficient HIV-1 infection in humanized mice. (A and B) Expansion of WT and vpu-deficient HIV-1 in humanized mice. WT HIV-1 (3,000 TCID50, n = 6; 30,000 TCID50, n = 5; and 300,000 TCID50, n = 21) and vpu-deficient HIV-1 (3,000 TCID50, n = 6; 30,000 TCID50, n = 5, and 300,000 TCID50, n = 20) were inoculated into humanized mice aged between 12 and 17 weeks old, and the amount of viral RNA in plasma was quantified at 3, 7, 14, and 21 dpi. (A) Frequency of infection in mice. The percentage of infected mice in which viral RNA in plasma was detected at each time point is presented as Kaplan-Meier curves. (B) Viral load in infected humanized mice. The horizontal broken line indicates the detection limit of the assay (1,600 copies/ml). (C to E) Cytopathic effect of WT and vpu-deficient HIV-1 in the PB of humanized mice. The numbers of total CD4+ T cells (CD45+ CD3+ CD4+ cells; C), Tn cells (CD45+ CD3+ CD4+ CD45RA+ cells; D), and Tm cells (CD45+ CD3+ CD4+ CD45RA cells; E) in the PB of WT HIV-1-infected mice (3,000 TCID50, n = 6; 30,000 TCID50, n = 5, and 300,000 TCID50, n = 11), vpu-deficient HIV-1-infected mice (3,000 TCID50, n = 6; 30,000 TCID50, n = 5, and 300,000 TCID50, n = 11), and mock-infected mice (n = 7) were routinely analyzed by flow cytometry and hematocytometry. (F) Cytopathic effect of WT and vpu-deficient HIV-1 in the lymphoid tissues of humanized mice. The percentages of total CD4+ T cells, Tn cells, and Tm cells in the spleen (left) and the BM (right) of WT HIV-1-infected mice (300,000 TCID50, n = 7) and vpu-deficient HIV-1-infected mice (300,000 TCID50, n = 7), and mock-infected mice (21 dpi, n = 6) were analyzed by flow cytometry. In panel A, statistical difference was determined by a log rank test. In panel B, statistical difference between WT HIV-1 versus vpu-deficient HIV-1 was determined by Welch's t test. In panels C to F, statistical difference between mock-infected versus WT HIV-1- or vpu-deficient HIV-1-infected mice was determined by Welch's t test. Statistically significant differences are shown as follows: *, P < 0.05; **, P < 0.01; ***, P < 0.001. Error bars represent SEMs. NS, no statistical significance.
Fig 3
Fig 3
Characteristics of infected cells in humanized mice.(A) PCR analysis of proviral DNA. The regions of gag and vpu in HIV-1 DNA in the spleen of two WT HIV-1-infected mice, three vpu-deficient HIV-1-infected mice, and a mock-infected mouse at 21 dpi were analyzed by PCR. The mouse numbers correspond to those in Table 1. A representative result is shown. As the positive controls for gag and vpu, a WT HIV-1 plasmid (pAD8+) and vpu-deficient HIV-1 plasmid (pAD8-UDEL2) were used. Note that the band size of vpu in vpu-deficient HIV-1-infected mice is smaller than that in WT HIV-1-infected mice because of the 81-bp deletion with frameshift (see Materials and Methods for detail). ACTB (β-actin) was used as the internal control of the assay. (B and C) Characterization of infected cells. Human MNCs in the spleen of WT HIV-1-infected mice, vpu-deficient HIV-1-infected mice, and mock-infected mice were analyzed by flow cytometry. Representative dot plots and histograms are shown (B). The numbers in dot plots and histograms indicate the percentages of positive cells in each parental population, and the vertical broken lines indicate the threshold for the gating of positive cells based on the result from the isotype controls. (C) The percentages of CD3+ T cells in Gag-positive cells (left) and the percentages of Tn cells (CD45RA+) and Tm cells (CD45RA) in infected T cells (Gag+ CD3+ CD8cells, right) in the spleen of WT HIV-1-infected mice (n = 7) and vpu-deficient HIV-1-infected mice (n = 8) are shown.
Fig 4
Fig 4
Viral dissemination in the PB and lymphoid organs of humanized mice. (A) Cell-free virions in the PB and lymphoid organs of infected mice. The amounts of cell-free virus in the plasma (left), the supernatant of splenic suspension (middle), and the BM fluid (right) of WT HIV-1-infected mice (300,000 TCID50, 7 and 21 dpi; n = 7) and vpu-deficient HIV-1-infected mice (300,000 TCID50, 7 and 21 dpi; n = 8) were quantified by p24 ELISA. (B) The percentage of HIV-1 Gag-positive cells in the PB (left), the spleen (middle), and the BM (right) of WT HIV-1-infected mice (300,000 TCID50, 7 and 21 dpi; n = 7), vpu-deficient HIV-1-infected mice (300,000 TCID50, 7 and 21 dpi; n = 8), and mock-infected mice (21 dpi; n = 7) were analyzed by flow cytometry. (C) Correlation of the amount of cell-free virions and the percentage of infected cells. The results of the percentage of Gag-positive cells in spleen at 7 dpi (x axis) and the amount of cell-free Gag proteins in splenic fluid at 7 dpi (y axis) from WT HIV-1-infected mice (300,000 TCID50; n = 10) and vpu-deficient HIV-1-infected mice (300,000 TCID50; n = 9) are plotted. The lines represent exponential approximation. The Pearson correlation coefficient (r) was adopted to determine statistically significant correlation between each value, and a P value of <0.05 was considered statistically significance. (D) The MFIs of Gag (Pr55Gag) in Gag-positive cells (right) in the spleen of WT HIV-1-infected mice (300,000 TCID50; n = 7) and vpu-deficient HIV-1-infected mice (300,000 TCID50; n = 7) were analyzed by flow cytometry at 7 dpi. Error bars represent SEMs. ND, not detected; NS, no statistical significance.
Fig 5
Fig 5
Surface expression profile of CD4, BST2, and SLAMF6 in infected humanized mice at 7 dpi. Tm cells (CD3+ CD8 CD45RA) in the spleen of WT HIV-1-infected mice (300,000 TCID50; n = 7), vpu-deficient HIV-1-infected mice (300,000 TCID50; n = 6), and mock-infected mice (n = 7) at 7 dpi were classified into infected (Gag-positive) or uninfected (Gag-negative) populations by using an anti-p24 antibody. Representative histograms (left), the positive percentages (middle), and the MFIs (right) of CD4 (A), BST2 (B), and SLAMF6 (C) in each population are shown. In the left panels, the numbers on each histogram indicate the MFI values, and the vertical broken lines indicate the thresholds for the gating of positive cells based on the result from the isotype controls. The statistical difference is determined by Welch's t test. Statistically significant differences are shown as follows: *, P < 0.05; **, P < 0.01; ***, P < 0.001. Error bars represent SEMs. NS, no statistical significance.
Fig 6
Fig 6
Codownregulation of CD4 and BST2 from the surface of WT HIV-1-infected cells. Surface expression levels of CD4 and BST2 on the surface of Gag-positive Tm cells (CD3+ CD8 CD45RA Gag+) or Gag-negative Tm cells (CD3+ CD8 CD45RA Gag) in the spleen of WT HIV-1-infected mice (300,000 TCID50; n = 6), vpu-deficient HIV-1-infected mice (300,000 TCID50; n = 5), and mock-infected mice (n = 7) at 7 dpi were analyzed by flow cytometry. Representative dot plots (A to C) and the summarized results (D and E) are shown. In panels A to C, the numbers indicate the percentages of the cells in the respective quadrant. The statistical difference is determined by Welch's t test (*, P < 0.05). Error bars represent SEMs.
Fig 7
Fig 7
Surface expression profile of CD4, BST2, and SLAMF6 in infected humanized mice at 21 dpi. Tm cells (CD3+ CD8CD45RA; A to C), Tn cells (CD3+ CD8 CD45RA+; D), and CD8+ T cells (CD3+ CD8+; E) in the spleen of WT HIV-1-infected mice (300,000 TCID50; n = 5), vpu-deficient HIV-1-infected mice (300,000 TCID50; n = 7), and mock-infected mice (n = 7) at 21 dpi were analyzed by flow cytometry. Tm cells were further classified into infected (Gag-positive) or uninfected (Gag-negative) populations by using an anti-p24 antibody. Representative histograms (left), the positive percentages (middle), and the MFIs (right) of CD4 (A), BST2 (B, D, and E), and SLAMF6 (C) in each population are shown. In the left panels, the numbers on the histograms indicate the MFI values, and the vertical broken lines indicate the thresholds for the gating of positive cells based on the result from the isotype controls. The statistical difference is determined by Welch's t test. Statistically significant differences are shown as follows: *, P < 0.05; **, P < 0.01; ***, P < 0.001. Error bars represent SEMs. NS, no statistical significance.
Fig 8
Fig 8
Immunostaining for HIV-1 Gag protein.(A) Representatives of the spleen of WT HIV-1-infected mice (left) and vpu-deficient HIV-1-infected mice (right). HIV-1 Gag is shown in red, and nuclei are shown in blue by staining with Hoechst 33342. Boxed areas are enlarged in the bottom right of each panel. Scale bar, 50 μm. (B) A representative of the Gag-positive cell contacted with (solid-line box) or without (broken-line box) the other adjunct Gag-positive cell in spleen is shown (top). The middle panel shows enlargements of the boxed areas. (bottom) The fluorescent intensities of Hoechst (blue) and Gag (red) indicated by arrowheads in the middle panels are shown. AU, arbitrary unit. (C) The percentages of the Gag-positive cells that are contacted with the other adjunct Gag-positive cells in the spleen of WT HIV-1-infected mice (n = 272) and vpu-deficient HIV-1-infected mice (n = 448) are shown.
Fig 9
Fig 9
Different potentials of CD4 and BST2 in the production of infectious cell-free virions and cell-to-cell HIV-1 transmission. A total of 800 ng of pAD8+ (WT HIV-1-producing plasmid), pAD8-UDEL2 (vpu-deficient HIV-1-producing plasmid), or pUC19 (parental plasmid; vector) was cotransfected with either 10 ng of CD4 expression plasmid (pCD4) or BST2 expression plasmid (pBST2) or both into HEK293 cells. peGFP-C1 (100 ng) was also cotransfected to monitor transfection efficiency. The assay was performed in quadruplicate. (A to C) Downregulation of surface CD4 and BST2. The surface expression levels of CD4 and BST2 on the transfected HEK293 cells (i.e., GFP-positive cells) at 48 h posttransfection were assessed by flow cytometry. The positive percentage (left) and the MFI (right) are shown. The percentage of the cells negative for both CD4 and BST2 in the cells cotransfected with both pCD4 and pBST2 is also shown (C). (D and E) Infectious potentials of cell-free virions in culture supernatant and transfected cells. The infectivities of the viruses in the supernatant and the transfected cells (coculture) were titrated by TZM-bl assay and were normalized to the values per culture. Statistically significant differences (determined by Student's t test) are shown as follows: *, P < 0.05; **, P < 0.01; ***, P < 0.001. Error bars represent SEMs.

Similar articles

Cited by

References

    1. An DS, et al. 2007. Use of a novel chimeric mouse model with a functionally active human immune system to study human immunodeficiency virus type 1 infection. Clin. Vaccine Immunol. 14:391–396 - PMC - PubMed
    1. Andrew A, Strebel K. 2011. The interferon-inducible host factor bone marrow stromal antigen 2/tetherin restricts virion release, but is it actually a viral restriction factor? J. Interferon Cytokine Res. 31:137–144 - PMC - PubMed
    1. Arganaraz ER, Schindler M, Kirchhoff F, Cortes MJ, Lama J. 2003. Enhanced CD4 down-modulation by late stage HIV-1 nef alleles is associated with increased Env incorporation and viral replication. J. Biol. Chem. 278:33912–33919 - PubMed
    1. Carr JM, Hocking H, Li P, Burrell CJ. 1999. Rapid and efficient cell-to-cell transmission of human immunodeficiency virus infection from monocyte-derived macrophages to peripheral blood lymphocytes. Virology 265:319–329 - PubMed
    1. Casartelli N, et al. 2010. Tetherin restricts productive HIV-1 cell-to-cell transmission. PLoS Pathog. 6:e1000955. - PMC - PubMed

Publication types

MeSH terms

Substances