

Target identification by chromatographic co-elution: monitoring of drug-protein interactions without immobilization or chemical derivatization
- PMID: 22357554
- PMCID: PMC3394955
- DOI: 10.1074/mcp.M111.016642
Target identification by chromatographic co-elution: monitoring of drug-protein interactions without immobilization or chemical derivatization
Abstract
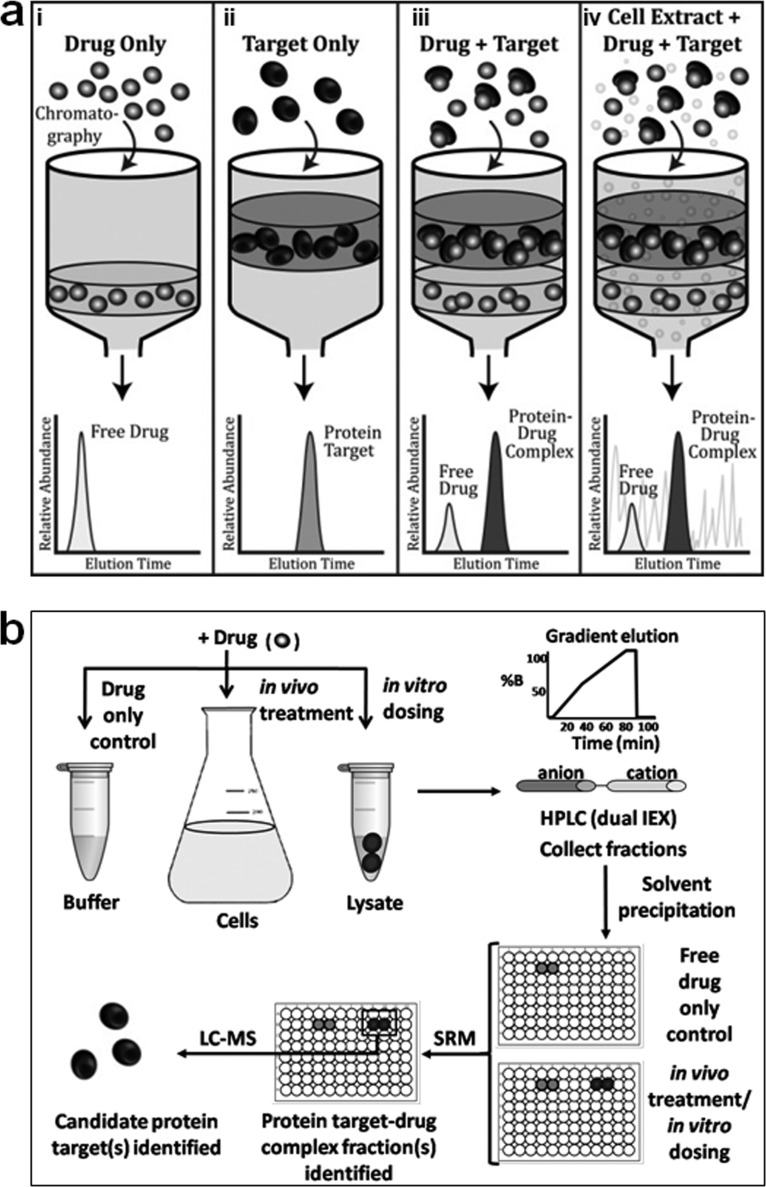
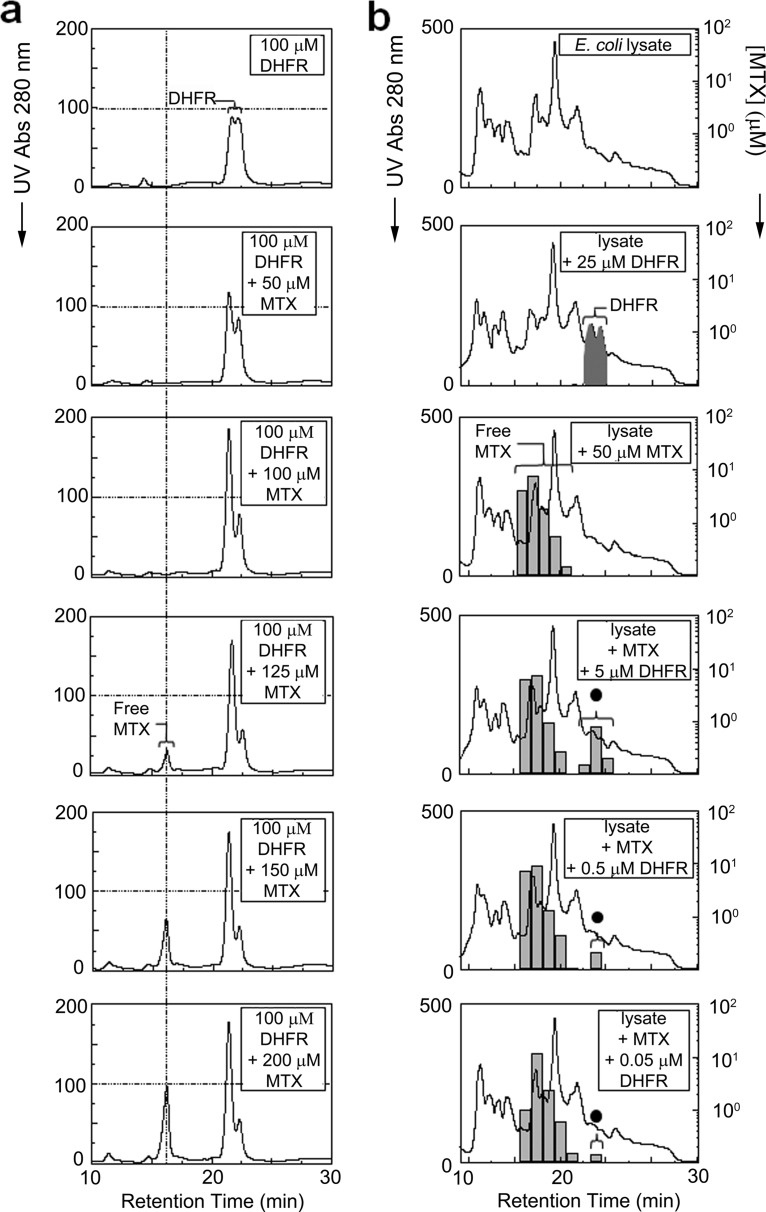
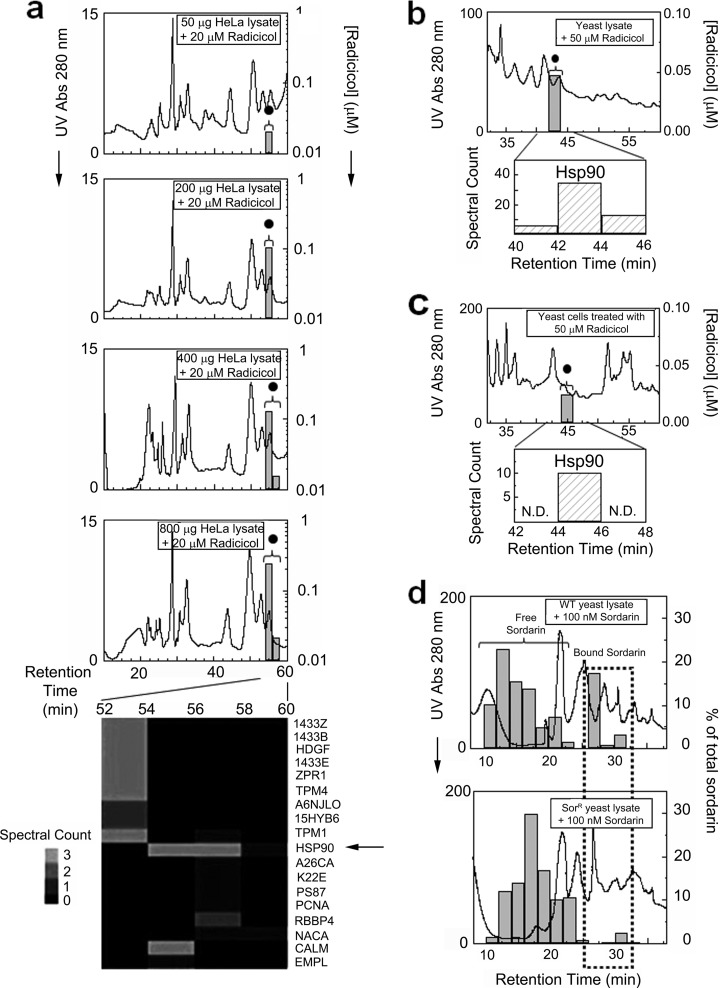
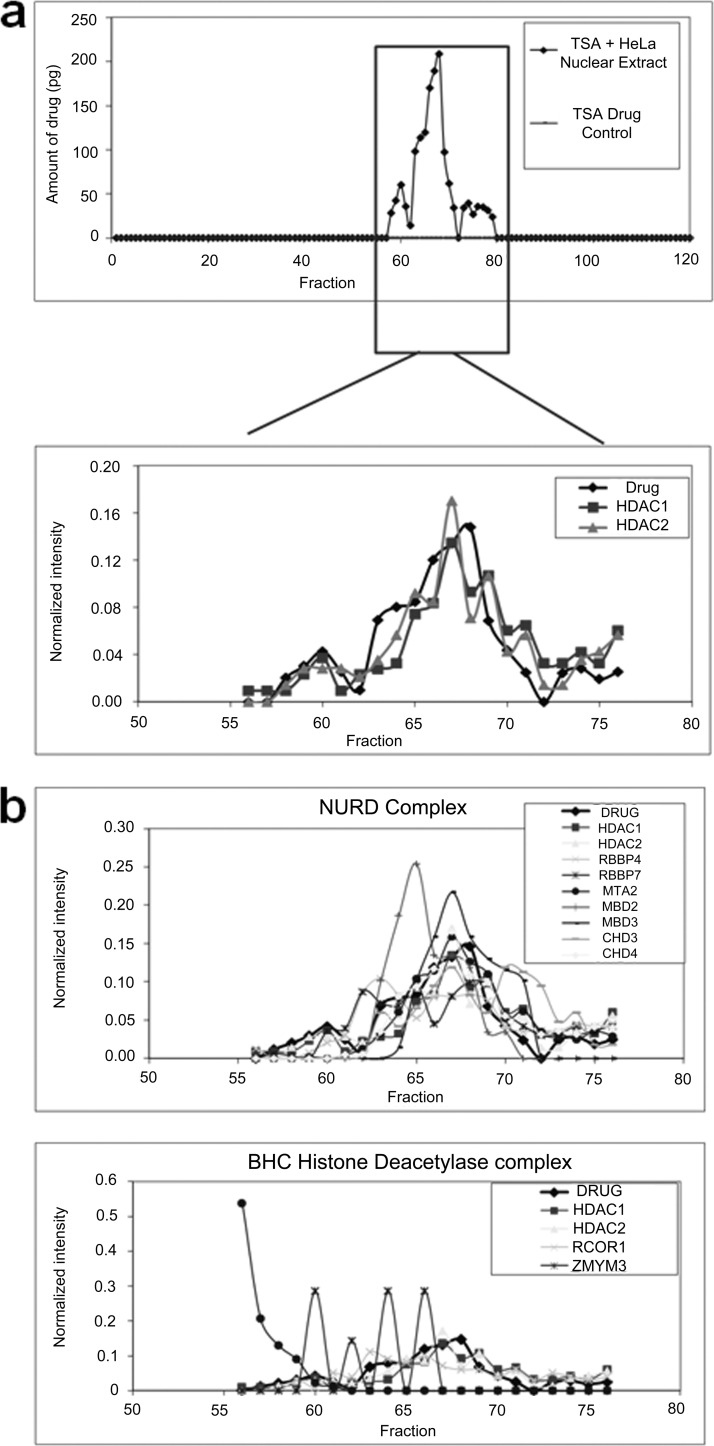
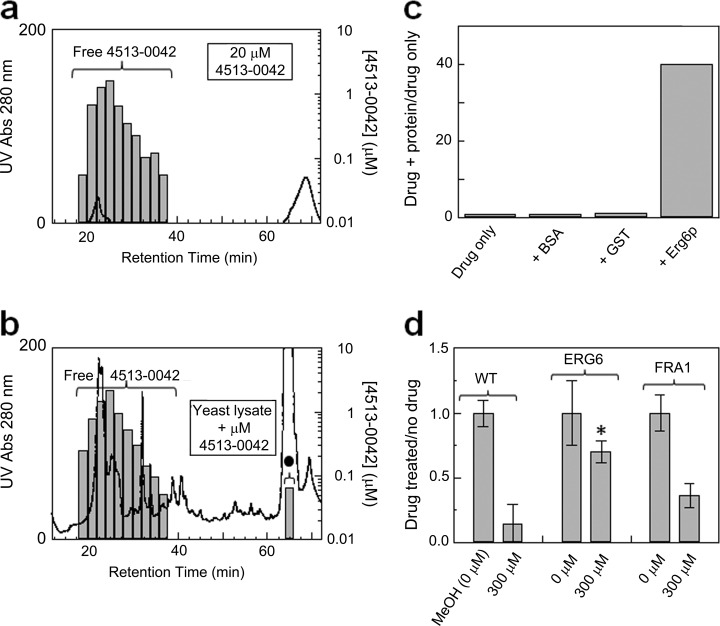
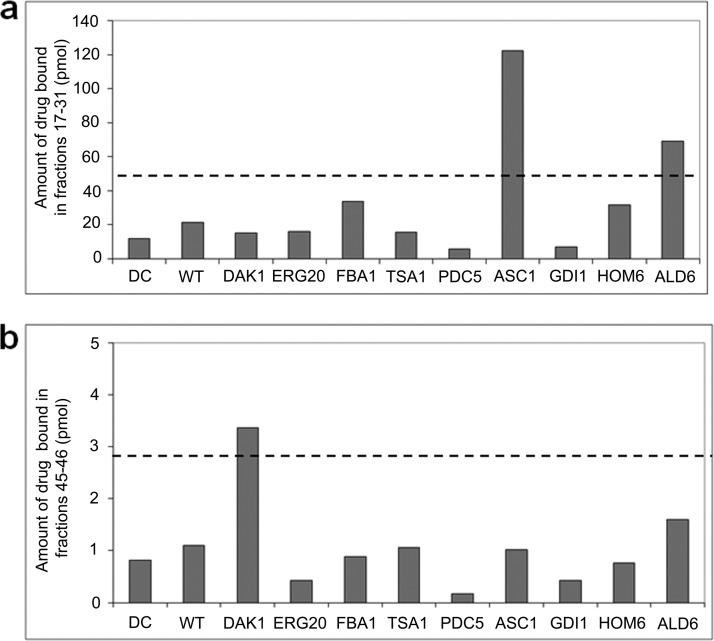
Bioactive molecules typically mediate their biological effects through direct physical association with one or more cellular proteins. The detection of drug-target interactions is therefore essential for the characterization of compound mechanism of action and off-target effects, but generic label-free approaches for detecting binding events in biological mixtures have remained elusive. Here, we report a method termed target identification by chromatographic co-elution (TICC) for routinely monitoring the interaction of drugs with cellular proteins under nearly physiological conditions in vitro based on simple liquid chromatographic separations of cell-free lysates. Correlative proteomic analysis of drug-bound protein fractions by shotgun sequencing is then performed to identify candidate target(s). The method is highly reproducible, does not require immobilization or derivatization of drug or protein, and is applicable to diverse natural products and synthetic compounds. The capability of TICC to detect known drug-protein target physical interactions (K(d) range: micromolar to nanomolar) is demonstrated both qualitatively and quantitatively. We subsequently used TICC to uncover the sterol biosynthetic enzyme Erg6p as a novel putative anti-fungal target. Furthermore, TICC identified Asc1 and Dak1, a core 40 S ribosomal protein that represses gene expression, and dihydroxyacetone kinase involved in stress adaptation, respectively, as novel yeast targets of a dopamine receptor agonist.
Figures
Similar articles
-
Capturing the Asc1p/Receptor for Activated C Kinase 1 (RACK1) Microenvironment at the Head Region of the 40S Ribosome with Quantitative BioID in Yeast.Mol Cell Proteomics. 2017 Dec;16(12):2199-2218. doi: 10.1074/mcp.M116.066654. Epub 2017 Oct 5. Mol Cell Proteomics. 2017. PMID: 28982715 Free PMC article.
-
Asc1p/RACK1 Connects Ribosomes to Eukaryotic Phosphosignaling.Mol Cell Biol. 2017 Jan 19;37(3):e00279-16. doi: 10.1128/MCB.00279-16. Print 2017 Feb 1. Mol Cell Biol. 2017. PMID: 27821475 Free PMC article.
-
Communication between RACK1/Asc1 and uS3 (Rps3) is essential for RACK1/Asc1 function in yeast Saccharomyces cerevisiae.Gene. 2019 Jul 20;706:69-76. doi: 10.1016/j.gene.2019.04.087. Epub 2019 May 1. Gene. 2019. PMID: 31054365 Free PMC article.
-
Elucidating TOR signaling and rapamycin action: lessons from Saccharomyces cerevisiae.Microbiol Mol Biol Rev. 2002 Dec;66(4):579-91, table of contents. doi: 10.1128/MMBR.66.4.579-591.2002. Microbiol Mol Biol Rev. 2002. PMID: 12456783 Free PMC article. Review.
-
Receptor-mediated protein sorting to the vacuole in yeast: roles for a protein kinase, a lipid kinase and GTP-binding proteins.Annu Rev Cell Dev Biol. 1995;11:1-33. doi: 10.1146/annurev.cb.11.110195.000245. Annu Rev Cell Dev Biol. 1995. PMID: 8689553 Review.
Cited by
-
Improved deconvolution of natural products' protein targets using diagnostic ions from chemical proteomics linkers.Beilstein J Org Chem. 2024 Sep 12;20:2323-2341. doi: 10.3762/bjoc.20.199. eCollection 2024. Beilstein J Org Chem. 2024. PMID: 39290210 Free PMC article. Review.
-
New opportunities and challenges of natural products research: When target identification meets single-cell multiomics.Acta Pharm Sin B. 2022 Nov;12(11):4011-4039. doi: 10.1016/j.apsb.2022.08.022. Epub 2022 Aug 27. Acta Pharm Sin B. 2022. PMID: 36386472 Free PMC article. Review.
-
Drug target identification using network analysis: Taking active components in Sini decoction as an example.Sci Rep. 2016 Apr 20;6:24245. doi: 10.1038/srep24245. Sci Rep. 2016. PMID: 27095146 Free PMC article.
-
Mapping protein-metabolite interactions in E. coli by integrating chromatographic techniques and co-fractionation mass spectrometry.iScience. 2025 May 8;28(6):112611. doi: 10.1016/j.isci.2025.112611. eCollection 2025 Jun 20. iScience. 2025. PMID: 40491478 Free PMC article.
-
Target identification and mechanism of action in chemical biology and drug discovery.Nat Chem Biol. 2013 Apr;9(4):232-40. doi: 10.1038/nchembio.1199. Nat Chem Biol. 2013. PMID: 23508189 Free PMC article. Review.
References
-
- Chan J. N., Nislow C., Emili A. (2010) Recent advances and method development for drug target identification. Trends Pharmacol. Sci. 31, 82–88 - PubMed
-
- Schreiber S. L. (2000) Target-oriented and diversity-oriented organic synthesis in drug discovery. Science 287, 1964–1969 - PubMed
-
- Frantz S. (2005) Drug discovery: Playing dirty. Nature 437, 942–943 - PubMed
-
- Keiser M. J., Setola V., Irwin J. J., Laggner C., Abbas A. I., Hufeisen S. J., Jensen N. H., Kuijer M. B., Matos R. C., Tran T. B., Whaley R., Glennon R. A., Hert J., Thomas K. L., Edwards D. D., Shoichet B. K., Roth B. L. (2009) Predicting new molecular targets for known drugs. Nature 462, 175–181 - PMC - PubMed
-
- Mestres J., Gregori-Puigjané E. (2009) Conciliating binding efficiency and polypharmacology. Trends Pharmacol. Sci. 30, 470–474 - PubMed
Publication types
MeSH terms
Substances
LinkOut - more resources
Full Text Sources
Other Literature Sources
