Review
. 2012 Mar 15;215(Pt 6):986-96.
doi: 10.1242/jeb.058602.

Using tri-axial acceleration data to identify behavioral modes of free-ranging animals: general concepts and tools illustrated for griffon vultures

Affiliations
Review

Using tri-axial acceleration data to identify behavioral modes of free-ranging animals: general concepts and tools illustrated for griffon vultures

Ran Nathan et al. J Exp Biol. .

Abstract

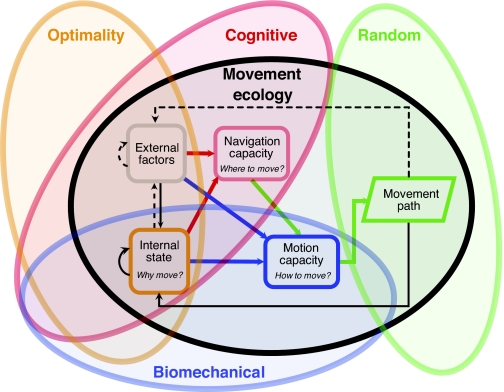
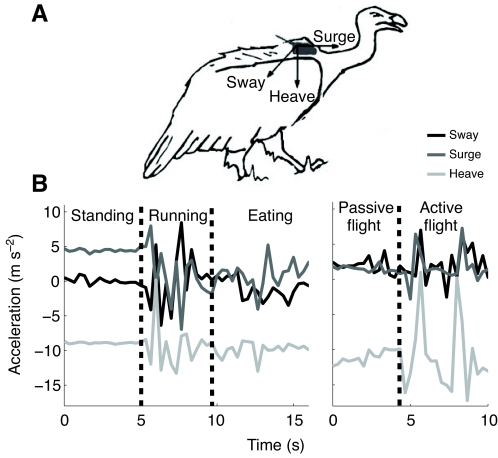
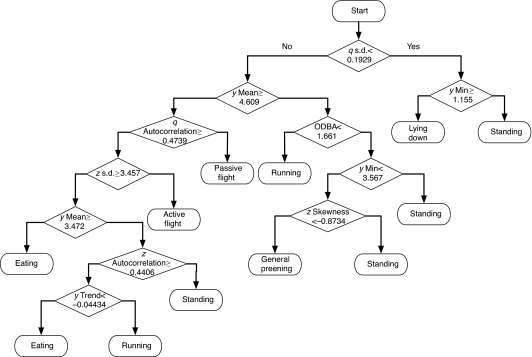
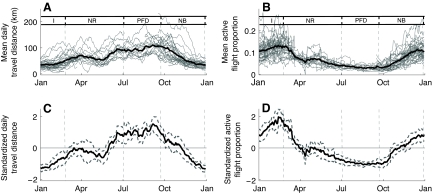
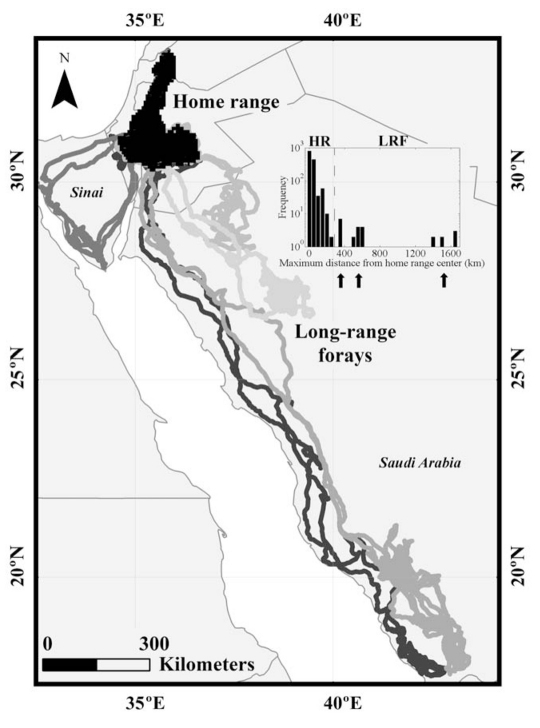
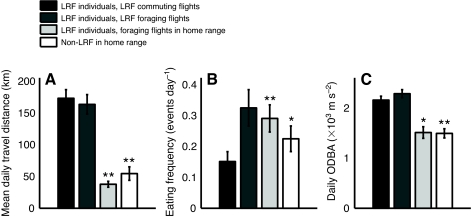
Integrating biomechanics, behavior and ecology requires a mechanistic understanding of the processes producing the movement of animals. This calls for contemporaneous biomechanical, behavioral and environmental data along movement pathways. A recently formulated unifying movement ecology paradigm facilitates the integration of existing biomechanics, optimality, cognitive and random paradigms for studying movement. We focus on the use of tri-axial acceleration (ACC) data to identify behavioral modes of GPS-tracked free-ranging wild animals and demonstrate its application to study the movements of griffon vultures (Gyps fulvus, Hablizl 1783). In particular, we explore a selection of nonlinear and decision tree methods that include support vector machines, classification and regression trees, random forest methods and artificial neural networks and compare them with linear discriminant analysis (LDA) as a baseline for classifying behavioral modes. Using a dataset of 1035 ground-truthed ACC segments, we found that all methods can accurately classify behavior (80-90%) and, as expected, all nonlinear methods outperformed LDA. We also illustrate how ACC-identified behavioral modes provide the means to examine how vulture flight is affected by environmental factors, hence facilitating the integration of behavioral, biomechanical and ecological data. Our analysis of just over three-quarters of a million GPS and ACC measurements obtained from 43 free-ranging vultures across 9783 vulture-days suggests that their annual breeding schedule might be selected primarily in response to seasonal conditions favoring rising-air columns (thermals) and that rare long-range forays of up to 1750 km from the home range are performed despite potentially heavy energetic costs and a low rate of food intake, presumably to explore new breeding, social and long-term resource location opportunities.


Figures

Fig. 1.
Fig. 1.
A movement ecology framework that integrates four existing paradigms for studying organismal movements. From Nathan et al. (Nathan et al., 2008); © 2008 National Academy of Sciences, USA.
Fig. 2.
Fig. 2.
(A) Schematic representation of a tri-axial accelerometer attached to a vulture, recording linear acceleration along the x (medial–lateral, sway), y (anterior–posterior, surge) and z (inferior–superior, heave) axes. (B) Two illustrative signals recorded by a tri-axial accelerometer (3.3 Hz per axis), demonstrating switches from standing through running to eating and from passive to active flight.
Fig. 3.
Fig. 3.
CART tree. Decision rules are evaluated downwards to arrive at each category prediction. At each rhombic branch node, a rightward move indicates a ‘yes’ or ‘true’ evaluation of the expression in the rhombus, whereas a leftward move indicates a ‘no’ or ‘false’ evaluation. Only the primary category for each leaf is shown. Probabilities for other categories for each leaf and branching point can also be determined based on the prior distribution of categories.
Fig. 4.
Fig. 4.
The changes in mean and standardized daily travel distances (A,C) and in mean and standardized proportions of active (flapping) flight of griffon vultures (B,D) across the year. Both parameters were averaged using a running window of 30 days, and the analysis was restricted to individuals tracked over 90 days (N=32). For vultures tracked for more than a year (N=11), overlapping dates of successive years were averaged. Thin gray lines in panels A and B represent individuals and thick dashed gray lines in C and D are 95% confidence intervals; the thick black line represents population averages. To compensate for interspecific differences in the mean and magnitude of variation of each parameter, the values of each individual were normalized to a standard normal distribution with (μ=0, σ=1) to obtain graphs C and D. Abbreviations indicate different phases in the annual cycle of a breeding vulture: I, incubation; NR, nestling rearing; PFD, post-fledging dependence; NB, non-breeding.
Fig. 5.
Fig. 5.
Exceptional long-range forays of individual griffon vultures trapped and tagged in the Judean and Negev Deserts of Israel. The histogram shows the frequency of the maximum displacement of a tracked bird from the center of its home range in non-overlapping intervals of 14 days. The six events defined as long-range forays (indicated by black arrows) are very rare (∼2.5% of the data set; note the log scale of the histogram). In three events, one in Sinai and two in northern Saudi Arabia, the vultures reached distances of 400 to 600 km from the home range center. On two other occasions, the vultures reached the border between Saudi Arabia and Yemen, over 1700 km from their home range center. The vast majority of the 43 tagged birds did not reach more than 200 km from their home range center. The population home range (black area mapped out in Israel and Jordan) is calculated from the entire dataset as the 95% kernel. HR, home range; LRF, long-range foray.
Fig. 6.
Fig. 6.
Pairwise comparisons among three measures – (A) mean daily travel distance, (B) eating frequency and (C) total daily ODBA – derived from the data (±s.d.) for an individual vulture in the following phases of its lifetime movement pathway: commuting phase of a long-range foray (LRF) event (black); foraging phase far from its home range (dark gray), in the home range shortly after return from the long journey (pale gray) and randomly selected conspecifics within the home range during the time of the LRF (white). Control groups that are significantly different from LRF events are marked as follows: *P≤0.05; **P≤0.01.

Similar articles

Cited by

References

    1. Altun K., Barshan B., Tuncel O. (2010). Comparative study on classifying human activities with miniature inertial and magnetic sensors. Pattern Recognit. 43, 3605–3620
    1. Boettiger A., Wittemyer G., Starfield R., Volrath F., Douglas-Hamilton I., Getz W. M. (2011). Inferring ecological and behavioral drivers of elephant movement using a linear filtering approach. Ecology 92, 1648–1657 - PubMed
    1. Bouten C. V., Westerterp K. R., Verduin M., Janssen J. D. (1994). Assessment of energy expenditure for physical activity using a triaxial accelerometer. Med. Sci. Sports Exerc. 26, 1516–1523 - PubMed
    1. Breiman L. (2001). Random forests. Mach. Learn. 45, 5–32
    1. Byrnes G., Libby T., Lim N. T. L., Spence A. J. (2011). Gliding saves time but not energy in Malayan colugos. J. Exp. Biol. 214, 2690–2696 - PubMed

Publication types