. 2012 Apr;23(8):1546-57.
doi: 10.1091/mbc.E11-09-0821. Epub 2012 Feb 22.

Requirement of translocated lysosomal V1 H(+)-ATPase for activation of membrane acid sphingomyelinase and raft clustering in coronary endothelial cells

Affiliations

Requirement of translocated lysosomal V1 H(+)-ATPase for activation of membrane acid sphingomyelinase and raft clustering in coronary endothelial cells

Ming Xu et al. Mol Biol Cell. 2012 Apr.

Abstract

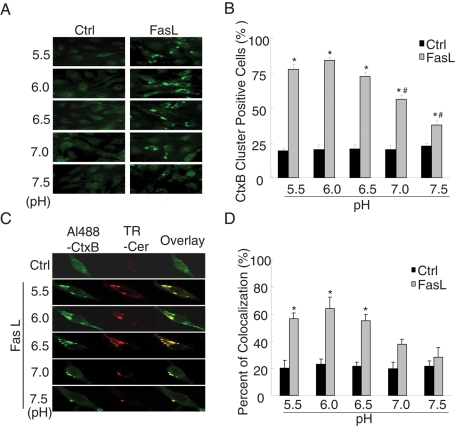
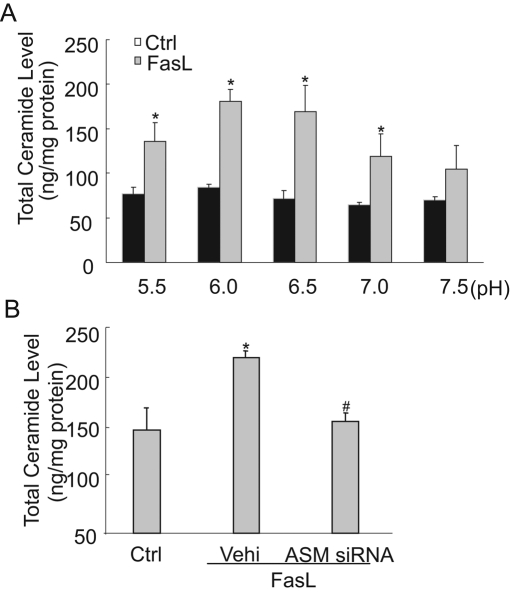
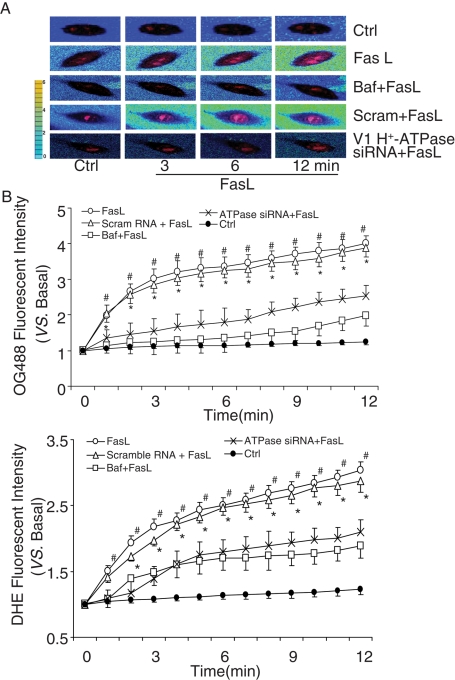
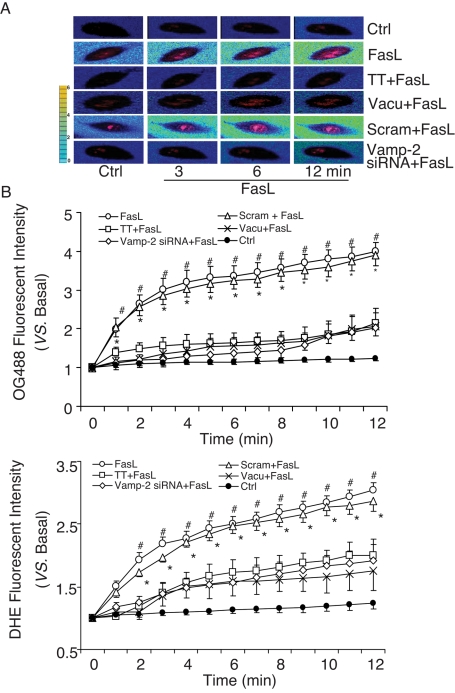
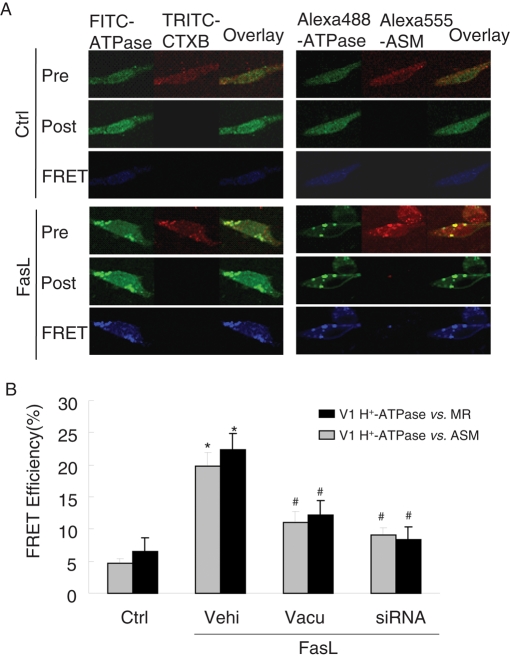
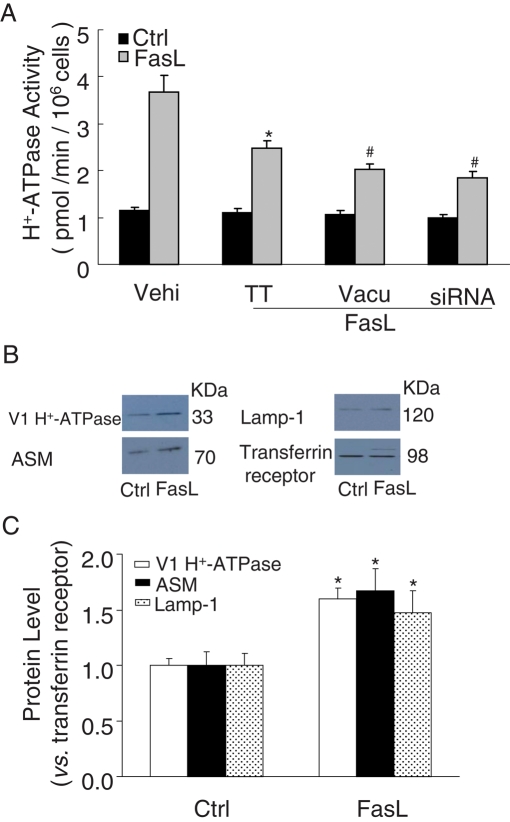
Acid sphingomyelinase (ASM) mediates the formation of membrane raft (MR) redox signalosomes in a process that depends on a local acid microenvironment in coronary arterial endothelial cells (CAECs). However, it is not known how this local acid microenvironment is formed and maintained. The present study hypothesized that lysosomal V1 H(+)-ATPase provides a hospitable acid microenvironment for activation of ASM when lysosomes traffic and fuse into the cell membrane. Confocal microscopy showed that local pH change significantly affected MRs, with more fluorescent patches under low pH. Correspondingly, the ASM product, ceramide, increased locally in the cell membrane. Electron spin resonance assay showed that local pH increase significantly inhibited NADPH oxidase-mediated production of O(2)(-.) in CAECs. Direct confocal microscopy demonstrated that Fas ligand resulted in localized areas of decreased pH around CAEC membranes. The inhibitors of both lysosomal fusion and H(+)-ATPase apparently attenuated FasL-caused pH decrease. V1 H(+)-ATPase accumulation and activity on cell membranes were substantially suppressed by the inhibitors of lysosomal fusion or H(+)-ATPase. These results provide the first direct evidence that translocated lysosomal V1 H(+)-ATPase critically contributes to the formation of local acid microenvironment to facilitate activation of ASM and consequent MR aggregation, forming MR redox signalosomes and mediating redox signaling in CAECs.


Figures

FIGURE 1:
FIGURE 1:
Effects of pH change on the colocalization of CtxB-staining fluorescent patches and ceramide. (A) Representative confocal microscopic images of CAECs stained by Al488-CtxB. (B) Summary of effects showing that FasL significantly increased the percentage of CtxB cluster–positive cells stained by Al488-CtxB at pH 5.5, 6.0, 6.5, 7.0, and 7.5. (C) Representative confocal microscopic images of the colocalization of CtxB-staining patches and ceramide in FasL-treated CAECs at different pH. Al488-CtxB is shown as a pseudo green on the left; Texas red–conjugated anti-ceramide is shown as red in the middle; and overlaid images are shown on the right. Yellow spots in the overlaid images were defined as patches of the colocalization in CtxB-staining patches and ceramide. The images are representatives from six separate batches of CAECs. (D) Percentage changes in positive cells costained by Al488-CtxB and anticeramide antibody during FasL stimulation (n = 6, *p < 0.05 vs. control; #p < 0.05 vs. pH = 6.0 group).
FIGURE 2:
FIGURE 2:
Measurements of ceramide in bovine CAECs by flow cytometry. (A) Frequency histogram of ceramide in control and FasL-treated cells exposed to pH 5.5, 6.0, 6.5, 7.0, and 7.5. (B) The percentage of ceramide positive-staining cells increased due to FasL treatment under different pH conditions. At pH 6.0, the percentage reached the maximum (n = 6, *p < 0.05 vs. control). (C) Top, no significant change of forward and side scatter under different pH conditions, which suggests that the treatment has no effect on cell size or granularity. Bottom, cell viability measured by flow cytometry. Cells were stained by ViaCount reagent. Viable cells appear at the bottom and dead cells at the top. The results show that the viability was not <95% under different pH conditions.
FIGURE 3:
FIGURE 3:
Measurement of ceramide concentration by liquid chromatography electrospray ionization tandem mass spectrometry. (A) Ceramide concentration in CAECs was increased due to FasL treatment under different pH conditions. Moreover, ceramide reached a maximum at pH 6.0. (B) ASM siRNA transfection significantly blocked the FasL-induced increase in ceramide production. (n = 4, *p < 0.05 vs. control; #p < 0.05 vs. only FasL-treated group).
FIGURE 4:
FIGURE 4:
ESR spectrometric analysis of O2−. production in bovine CAECs stimulated by FasL. (A) Representative ESR spectrographs of O2−. trapped by CMH using NADPH as substrate. (B) Summary of data showing that O2−. production following FasL treatment (10 ng/ml) markedly increased and gradually decreased as the extracellular pH increased from 6.0 to 7.5 (n = 6, *p < 0.05 vs. control; #p < 0.05 vs. pH = 6.0 group).
FIGURE 5:
FIGURE 5:
Effects of lysosome fusion inhibition on the CtxB-staining fluorescent patches and ceramide. (A) Percentage changes in positive cells costained by Al488-CtxB and anticeramide antibody in FasL-stimulated CAECs pretreated with lysosome fusion inhibitor vacuolin-1 (10 μM), ASM inhibitor Ami (20 μM), ASM siRNA, V1 H+-ATPase siRNA, and its inhibitor Baf (100 nM). (n = 6, p < 0.05 vs. control; #p < 0.05 vs. only FasL-treated group). (B) Distribution and localization of H+-ATPase as a MR redox platform on the membrane in CAECs treated with FasL alone or with FasL after pretreatment of V1 H+-ATPase siRNA. Fractions 3–5 were designated as MRs, as indicated by the marker protein flotillin-1. The blot pattern for H+-ATPase represents four individual experiments. Na+/K+-ATPase could also be detected in membrane raft fractions. However, no marked increase in the Na+/K+-ATPase protein in MR microdomains was observed in FasL-treated CAECs.
FIGURE 6:
FIGURE 6:
Role of lysosomal H+-ATPase in extracellular pH and O2−. production in bovine CAECs. (A) Typical merged images of OG488 and DHE fluorescence using an Olympus scanning confocal microscope at excitation/emission of 480/610 nm and 495/524 nm. The change of OG488 fluorescence intensity was recorded with pseudo color, which shows blue to green and then to yellow with increasing fluorescence intensity. (B) Summary of data showing that treatments with Baf (100 nM) or V1 H+-ATPase siRNA significantly inhibited FasL-induced changes in extracellular pH and intracellular O2−. production in CAECs (n = 6, *p < 0.05 vs. V1 H+-ATPase siRNA–treated group; #p < 0.05 vs. Baf-treated group).
FIGURE 7:
FIGURE 7:
Effects of lysosomal fusion on extracellular pH and intracellular O2−. production in bovine CAECs. (A) Typical merged images of OG488 and DHE fluorescence. The change of OG488 fluorescence intensity was recorded in pseudo color. (B) Summary of data showing that TT (10 nM), vacuolin-1 (10 μM), and vamp-2 siRNA significantly inhibited FasL-induced changes in extracellular pH and intracellular O2−. production in CAECs (n = 6, *p < 0.05 vs. Vamp-2 siRNA–treated group; #p < 0.05 vs. vacuolin-1 or TT-treated group).
FIGURE 8:
FIGURE 8:
Measurements of H+-ATPase translocation in bovine CAECs with flow cytometry. (A) Frequency histogram of H+-ATPase in the membranes of control or FasL-stimulated (10 ng/ml for 15 min) cells without or with TT (10 nM) or vacuolin-1 (10 μM) and the overlay. (B) The percentage of H+-ATPase positive–staining cells significantly increased in FasL-treated CAECs, which was suppressed by preincubation with vacuolin-1 or TT (n = 6, *p< 0.05 vs. control; #p < 0.05 vs. only FasL-treated group).
FIGURE 9:
FIGURE 9:
FRET analysis of the MR marker ganglioside GM1, H+-ATPase, and ASM in bovine CAECs. FRET was detected using an acceptor-bleaching protocol. The blue images (representing FRET) on the bottom were obtained by subtracting a prebleaching image from a postbleaching image. (A) Representative images of FRET between V1 H+-ATPase and GM1 (CtxB labeling) or ASM. (B) Summarized results of detected FRET efficiency show that FasL significantly increased the FRET efficiency between V1 H+-ATPase and GM1 or ASM, which was effectively inhibited by vacuolin-1(10 μM) or V1 H+-ATPase siRNA (n = 6, *p < 0.05 vs. control; #p < 0.05 vs. only FasL-treated group).
FIGURE 10:
FIGURE 10:
H+-ATPase activity and protein expression on the cell membrane of bovine CAECs. (A) FasL (10 ng/ml) dramatically enhanced the activity of H+-ATPase on the cell membrane of CAECs by fluorometry, which was inhibited by pretreatment of these cells with TT (10 nM), vacuolin-1 (10 μM), or V1 H+-ATPase siRNA (n = 6, *p 0.05 vs. control; #p < 0.05 vs. only FasL-treated group). (B) Cell surface biotinylation assay for H+-ATPase subunit of V1 sector protein expression in bovine CAECs. Western blot gel document presents the relative levels of V1 H+-ATPase, ASM, lamp-1, or transferrin receptor on the cell membrane of CAECs. (C) Summary of results showing that the intensity ratio of V1 H+-ATPase to transferrin receptor increased by 59.5% on the cell membrane in response to FasL (10 ng/ml) treatment. The intensity ratio of ASM or Lamp-1 to transferrin receptor increased by 67.1 or 47.7%, respectively, on the cell member (n = 3, *p < 0.05 vs. control).

Similar articles

Cited by

References

    1. Allen JA, Halverson-Tamboli RA, Rasenick MM. Lipid raft microdomains and neurotransmitter signalling. Nat Rev Neurosci. 2007;8:128–140. - PubMed
    1. Baader AP, Buchler L, Bircher-Lehmann L, Kleber AG. Real time, confocal imaging of Ca(2+) waves in arterially perfused rat hearts. Cardiovasc Res. 2002;53:105–115. - PubMed
    1. Bao JX, Jin S, Zhang F, Wang ZC, Li N, Li PL. Activation of membrane NADPH oxidase associated with lysosome-targeted acid sphingomyelinase in coronary endothelial cells. Antioxid Redox Signal. 2010a;12:703–712. - PMC - PubMed
    1. Bao JX, Xia M, Poklis JL, Han WQ, Brimson C, Li PL. Triggering role of acid sphingomyelinase in endothelial lysosome-membrane fusion and dysfunction in coronary arteries. Am J Physiol Heart Circ Physiol. 2010b;298:H992–H1002. - PMC - PubMed
    1. Belusa R, Wang ZM, Matsubara T, Sahlgren B, Dulubova I, Nairn AC, Ruoslahti E, Greengard P, Aperia A. Mutation of the protein kinase C phosphorylation site on rat alpha1 Na+,K+-ATPase alters regulation of intracellular Na+ and pH and influences cell shape and adhesiveness. J Biol Chem. 1997;272:20179–20184. - PubMed

Publication types

MeSH terms