

Centrosome misorientation mediates slowing of the cell cycle under limited nutrient conditions in Drosophila male germline stem cells
- PMID: 22357619
- PMCID: PMC3327310
- DOI: 10.1091/mbc.E11-12-0999
Centrosome misorientation mediates slowing of the cell cycle under limited nutrient conditions in Drosophila male germline stem cells
Abstract
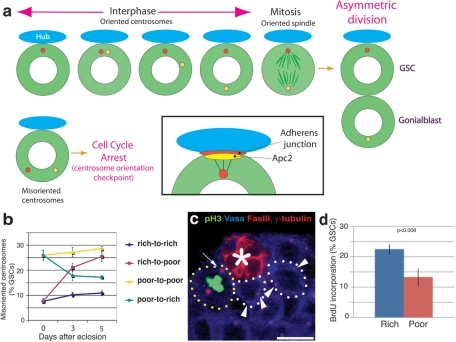
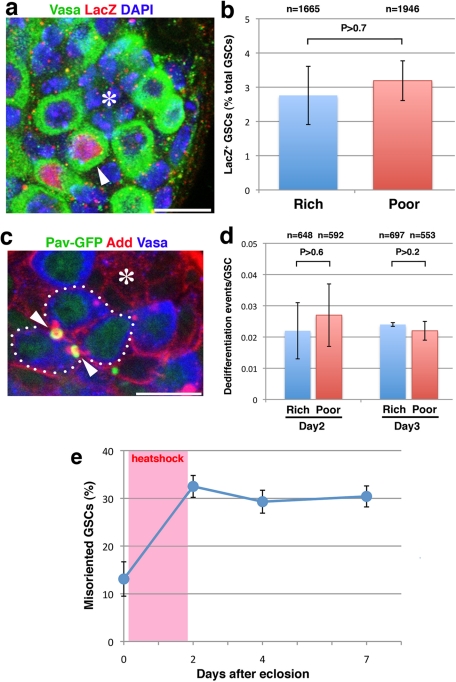
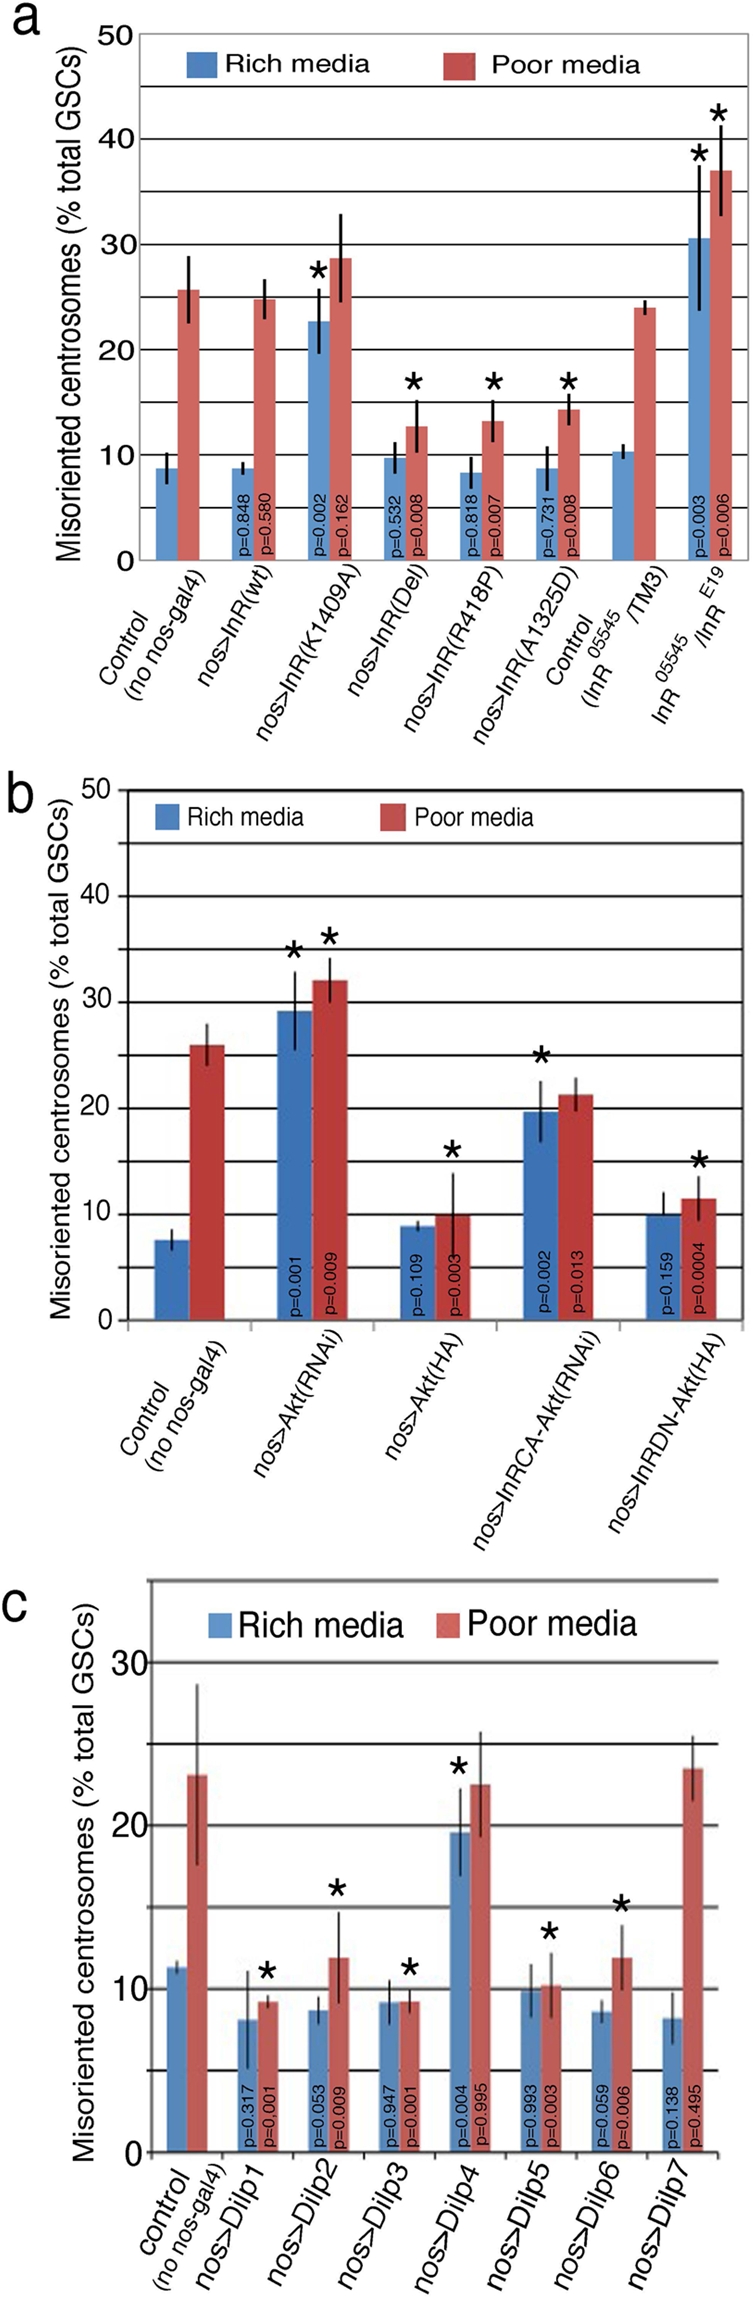
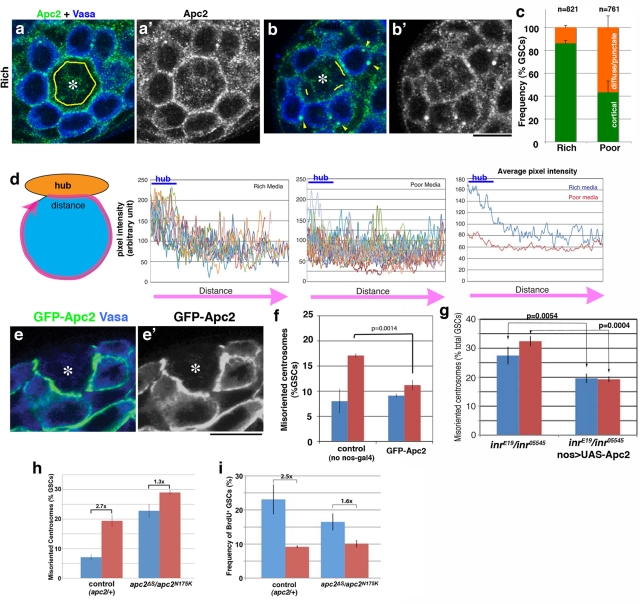
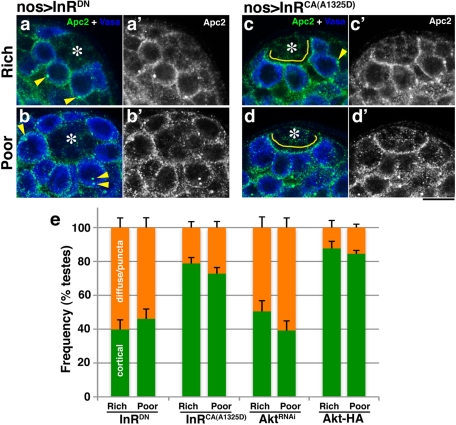
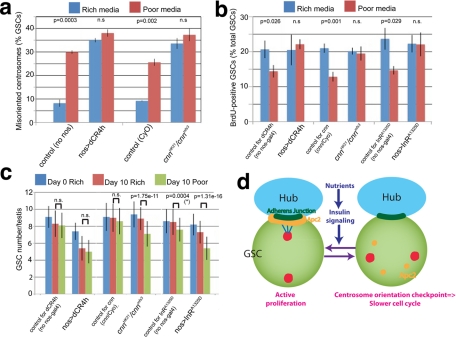
Drosophila male germline stem cells (GSCs) divide asymmetrically, balancing self-renewal and differentiation. Although asymmetric stem cell division balances between self-renewal and differentiation, it does not dictate how frequently differentiating cells must be produced. In male GSCs, asymmetric GSC division is achieved by stereotyped positioning of the centrosome with respect to the stem cell niche. Recently we showed that the centrosome orientation checkpoint monitors the correct centrosome orientation to ensure an asymmetric outcome of the GSC division. When GSC centrosomes are not correctly oriented with respect to the niche, GSC cell cycle is arrested/delayed until the correct centrosome orientation is reacquired. Here we show that induction of centrosome misorientation upon culture in poor nutrient conditions mediates slowing of GSC cell proliferation via activation of the centrosome orientation checkpoint. Consistently, inactivation of the centrosome orientation checkpoint leads to lack of cell cycle slowdown even under poor nutrient conditions. We propose that centrosome misorientation serves as a mediator that transduces nutrient information into stem cell proliferation, providing a previously unappreciated mechanism of stem cell regulation in response to nutrient conditions.
Figures
Similar articles
-
Live imaging of the Drosophila ovarian niche shows spectrosome and centrosome dynamics during asymmetric germline stem cell division.Development. 2021 Sep 15;148(18):dev199716. doi: 10.1242/dev.199716. Epub 2021 Sep 17. Development. 2021. PMID: 34370012 Free PMC article.
-
Regulation of cyclin A localization downstream of Par-1 function is critical for the centrosome orientation checkpoint in Drosophila male germline stem cells.Dev Biol. 2012 Jan 1;361(1):57-67. doi: 10.1016/j.ydbio.2011.10.010. Epub 2011 Oct 15. Dev Biol. 2012. PMID: 22024320 Free PMC article.
-
Orientation of asymmetric stem cell division by the APC tumor suppressor and centrosome.Science. 2003 Sep 12;301(5639):1547-50. doi: 10.1126/science.1087795. Science. 2003. PMID: 12970569
-
Fly meets yeast: checking the correct orientation of cell division.Trends Cell Biol. 2011 Sep;21(9):526-33. doi: 10.1016/j.tcb.2011.05.004. Epub 2011 Jun 24. Trends Cell Biol. 2011. PMID: 21705221 Free PMC article. Review.
-
When fate follows age: unequal centrosomes in asymmetric cell division.Philos Trans R Soc Lond B Biol Sci. 2014 Sep 5;369(1650):20130466. doi: 10.1098/rstb.2013.0466. Philos Trans R Soc Lond B Biol Sci. 2014. PMID: 25047620 Free PMC article. Review.
Cited by
-
Heparan sulfate regulates the number and centrosome positioning of Drosophila male germline stem cells.Mol Biol Cell. 2016 Mar 15;27(6):888-96. doi: 10.1091/mbc.E15-07-0528. Epub 2016 Jan 20. Mol Biol Cell. 2016. PMID: 26792837 Free PMC article.
-
Recent advances in Drosophila male germline stem cell biology.Spermatogenesis. 2012 Jul 1;2(3):137-144. doi: 10.4161/spmg.21763. Spermatogenesis. 2012. PMID: 23087833 Free PMC article.
-
Metabolic regulation of proteome stability via N-terminal acetylation controls male germline stem cell differentiation and reproduction.Nat Commun. 2023 Oct 23;14(1):6737. doi: 10.1038/s41467-023-42496-9. Nat Commun. 2023. PMID: 37872135 Free PMC article.
-
Conversion of quiescent niche cells to somatic stem cells causes ectopic niche formation in the Drosophila testis.Cell Rep. 2014 May 8;7(3):715-21. doi: 10.1016/j.celrep.2014.03.058. Epub 2014 Apr 18. Cell Rep. 2014. PMID: 24746819 Free PMC article.
-
Control of Germline Stem Cell Lineages by Diet and Physiology.Results Probl Cell Differ. 2017;59:67-99. doi: 10.1007/978-3-319-44820-6_3. Results Probl Cell Differ. 2017. PMID: 28247046 Free PMC article. Review.
References
-
- Brawley C, Matunis E. Regeneration of male germline stem cells by spermatogonial dedifferentiation in vivo. Science. 2004;304:1331–1334. - PubMed
-
- Brogiolo W, Stocker H, Ikeya T, Rintelen F, Fernandez R, Hafen E. An evolutionarily conserved function of the Drosophila insulin receptor and insulin-like peptides in growth control. Curr Biol. 2001;11:213–221. - PubMed
-
- Chen D, McKearin DM. A discrete transcriptional silencer in the bam gene determines asymmetric division of the Drosophila germline stem cell. Development. 2003;130:1159–1170. - PubMed
MeSH terms
Substances
LinkOut - more resources
Full Text Sources
Medical
Molecular Biology Databases
Research Materials
