. 2012 Apr;23(8):1569-81.
doi: 10.1091/mbc.E11-10-0849. Epub 2012 Feb 22.

Attenuation of TGF-β signaling suppresses premature senescence in a p21-dependent manner and promotes oncogenic Ras-mediated metastatic transformation in human mammary epithelial cells

Affiliations

Attenuation of TGF-β signaling suppresses premature senescence in a p21-dependent manner and promotes oncogenic Ras-mediated metastatic transformation in human mammary epithelial cells

Shu Lin et al. Mol Biol Cell. 2012 Apr.

Abstract

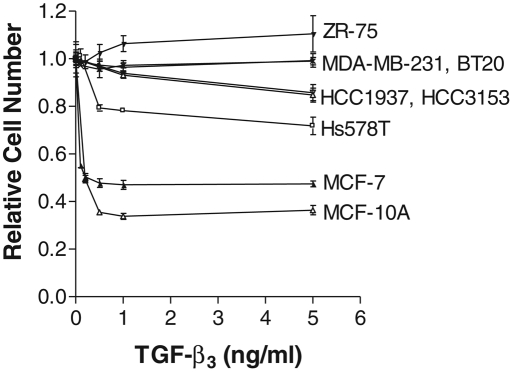
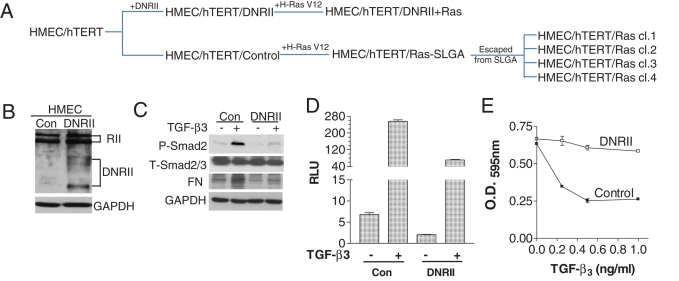
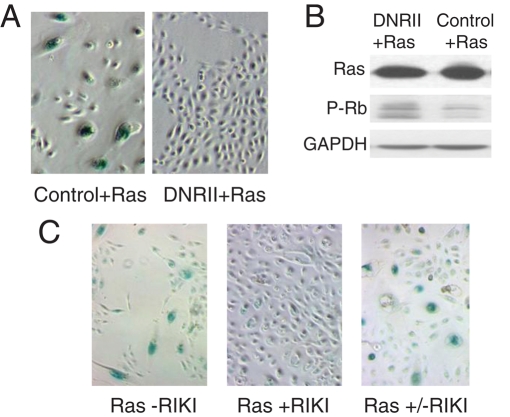
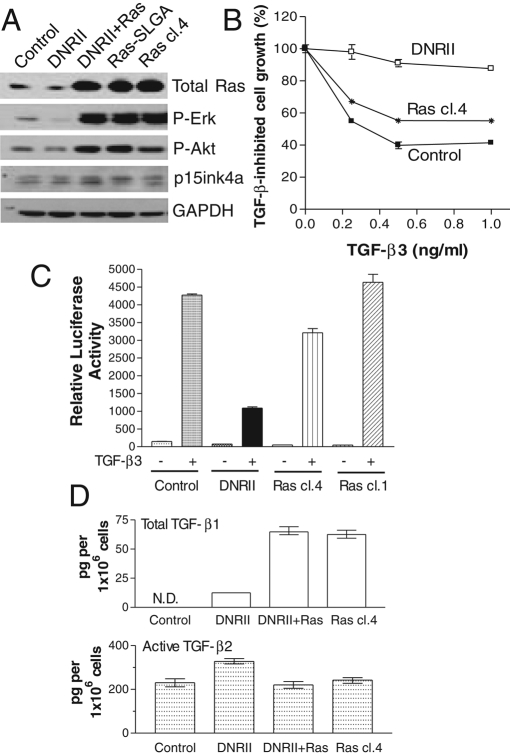
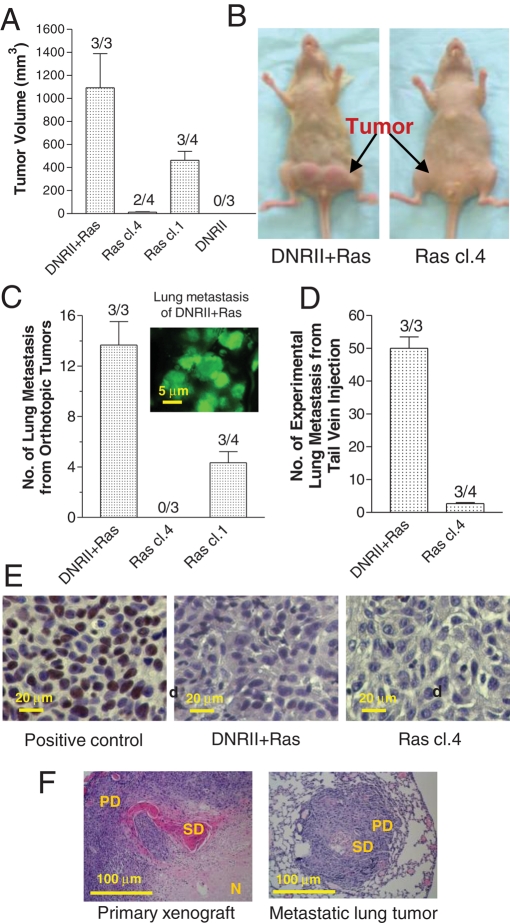
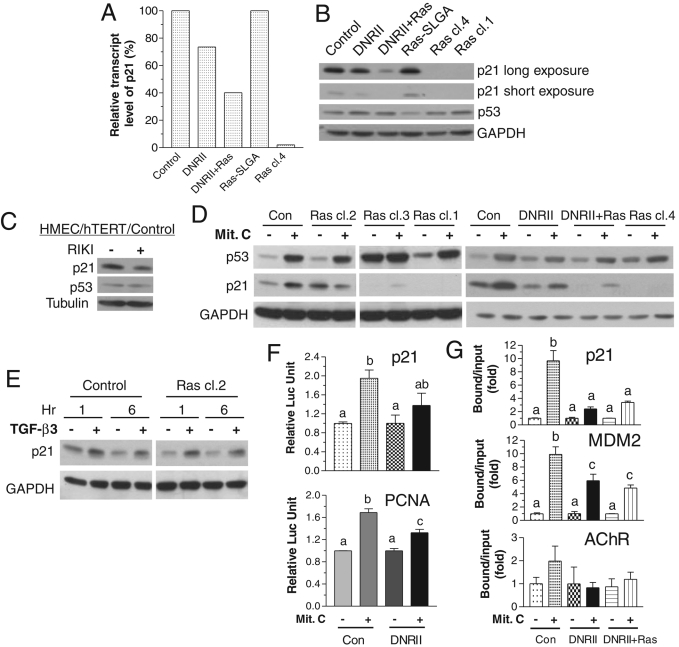
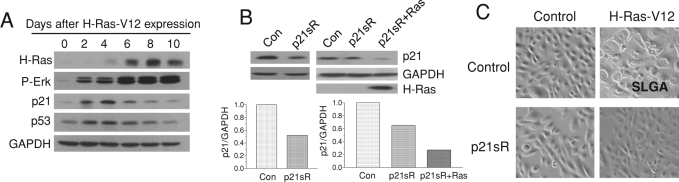
The molecular mechanisms that drive triple-negative, basal-like breast cancer progression are elusive. Few molecular targets have been identified for the prevention or treatment of this disease. Here we developed a series of isogenic basal-like human mammary epithelial cells (HMECs) with altered transforming growth factor-β (TGF-β) sensitivity and different malignancy, resembling a full spectrum of basal-like breast carcinogenesis, and determined the molecular mechanisms that contribute to oncogene-induced transformation of basal-like HMECs when TGF-β signaling is attenuated. We found that expression of a dominant-negative type II receptor (DNRII) of TGF-β abrogated autocrine TGF-β signaling in telomerase-immortalized HMECs and suppressed H-Ras-V12-induced senescence-like growth arrest (SLGA). Furthermore, coexpression of DNRII and H-Ras-V12 rendered HMECs highly tumorigenic and metastatic in vivo in comparison with H-Ras-V12-transformed HMECs that spontaneously escaped H-Ras-V12-induced SLGA. Microarray analysis revealed that p21 was the major player mediating Ras-induced SLGA, and attenuated or loss of p21 expression contributed to the escape from SLGA when autocrine TGF-β signaling was blocked in HMECs. Furthermore, knockdown of p21 also suppressed H-Ras-V12-induced SLGA. Our results identify that autocrine TGF-β signaling is an integral part of the cellular anti-transformation network by suppressing the expression of a host of genes, including p21-regulated genes, that mediate oncogene-induced transformation in basal-like breast cancer.


Figures

FIGURE 1:
FIGURE 1:
TGF-β signaling is attenuated in human triple-negative breast cancer cell lines. Breast cancer cells were plated in 96-well plates at 2000 cells/well and treated with various concentrations of TGF-β3 as depicted. MTT assays were performed after 5 d to obtain relative cell numbers. Each point is the mean ± SEM of four replicate wells.
FIGURE 2:
FIGURE 2:
Generation of hTERT-immortalized HMEC/DNRII cells. (A) A schematic flowchart of generating the hTERT-immortalized HMEC cell lines with altered TGF-β sensitivity, ectopic H-Ras-V12 expression, and different phenotypes. (B) DNRII protein expression was detectable in the DNRII and control (Con) HMECs with a Western blotting analysis. Glyceraldehyde-3-phosphate dehydrogenase (GAPDH) level was used to validate equal sample loading. (C) Control and DNRII HMECs were treated with or without 80 pM (2 ng/ml) TGF-β3 for 16 h, and cell lysate was used for Western blotting to detect phosphorylated Smad2 (P-Smad2), total Smad2/3 (T-Smad2/3), fibronectin (FN), and other gene products as depicted. (D) Control and DNRII HMECs were transiently transfected with pSBE4-Luc and β-gal expression constructs. Cells were treated with or without TGF-β3 (2 ng/ml) for 17 h. β-Gal–normalized luciferase activity (RLU) is presented as mean ± SEM from three transfections. (E) Control and DNRII HMECs were seeded in a 96-well plate at 2000 cells/well for 2 h and treated with indicated different concentrations of TGF-β3 for 4 d. MTT assay was performed to obtain OD values reflecting relative cell number. Each data point represents the mean ± SEM from four wells.
FIGURE 3:
FIGURE 3:
Blockade of TGF-β signaling inhibits Ras-induced senescence-like phenotypes. (A) Control and DNRII HMECs were transduced with a retrovirus carrying an expression cassette of H-Ras-V12. The stable cells were stained for SA-β-gal activity when the H-Ras-V12 cells showed senescence-like morphology. Elevated SA-β-gal activity was detected in the cells transfected with H-Ras-V12 as indicated with the dark, bluish-green staining. (B) Lysate of the DNRII + Ras and control + Ras cells were used in Western blotting for the measurements of the levels of total Ras (Pan-Ras), phosphorylated Rb (P-Rb), and GAPDH. (C) HMECs were treated without (–RIKI) or with (+RIKI) TβRI kinase inhibitor at 100 nM for 1 d and then transduced with Ras retrovirus. The cells labeled with Ras ± RIKI were initially treated with RIKI during first 8 d of Ras expression and then cultured without RIKI for additional 7 d. All cells were stained for SA-β-gal 15 d after Ras expression, and senescent cells were stained with a dark, bluish-green color as shown in A.
FIGURE 4:
FIGURE 4:
H-Ras-V12 HMEC clones spontaneously escape from SLGA. (A) Western analyses of total Ras, phosphorylated Erk (P-Erk), phosphorylated Akt (P-Akt), p15ink4b, and GAPDH in the depicted HMEC lines illustrating that DNRII + Ras, Ras-SLGA, and Ras clone 4 (Ras cl.4) have similar expression levels of these proteins. (B) Cells were plated in 96-well plates at 2000 cells/well and treated with various concentrations of TGF-β3 as depicted. MTT assays were performed after 4 d to obtain relative cell numbers. Each point is the mean ± SEM of four replicate wells. (C) Cells were transfected with pSBE4-Luc and a β-gal expression plasmid. They were then treated with or without TGF-β3 at 2 ng/ml for 19 h. The β-gal activity–normalized relative luciferase activity is shown as mean ± SEM from three transfections. (D) The media conditioned by confluent cultures of the cells in 2 ml for 48 h were used for the measurements of total or active TGF-β1 and TGF-β2 with sELISA.
FIGURE 5:
FIGURE 5:
Tumorigenic and metastatic properties of HMEC Ras clones and DNRII + Ras. (A) EGFP-labeled cells were injected orthotopically into both inguinal mammary glands using 4 × 10⁶ cells/site for DNRII + Ras and 10 × 106 cells/site for all other cells. The suspended cells were mixed with Matrigel at 1:1 ratio before injection. Four weeks after injection, tumor volumes were obtained with a caliper using the equation V = (L × W2) × 0.5, where V is volume, L is length, and W is width. The data are presented as mean ± SEM from four to six tumors in two or three mice. The numbers on each column indicate tumor incidence in the inoculated mice. (B) Representative orthotopic tumors of DNRII + Ras– and Ras cl.4–inoculated mice. (C) Green metastatic lung colonies in the lungs of the mice described in A were counted under an inverted fluorescence microscope. The data are presented as mean ± SEM from three mice. The numbers on each column indicate spontaneous metastasis incidence in the inoculated mice. A representative green fluorescence image (×40 magnification) was taken from a lung of a mouse inoculated with DNRII + Ras cells. (D) Number of lung metastases in mice injected with 0.2 × 10⁶ DNRII + Ras or Ras cl.4 cells through the tail vein. Green fluorescent lung metastases were counted after 10 wk and presented as mean ± SEM from three mice. (E) Histological examination for human ER-α expression of the primary tumors formed by DNRII + Ras or Ras cl.4 cells. ER-α–positive ZR-75-1 xenograft was used as a positive control. (F) Histological examination of the primary tumors and lung metastases formed by DNRII + Ras cells revealed poorly differentiated areas (PD) that are spindled and epithelioid. Some areas showed squamous differentiation with keratin pearl formation (SD). Some necrotic areas in the primary tumor (N) were also observed.
FIGURE 6:
FIGURE 6:
Blockade of TGF-β signaling overcomes H-Ras-V12–induced SLGA with significant down-regulation of p21 and transcriptional activity of p53. (A) p21 transcript levels in various HMEC cells normalized to that of the control cells from the microarray analysis. (B) p21, p53, and GAPDH protein levels in the cells analyzed with Western blotting. (C) HMEC control cells were treated without (Con) or with 100 nM RIKI for 4 d. p21 and p53 levels in the cells were measured with Western blotting. (D) Various HMEC cells were treated with Mit C at 5 μg/ml for 22 h. The cells were then harvested, and their extracts were used in Western blotting to measure the levels of p53, p21, and GAPDH. (E) Control and Ras cl.2 were treated with TGF-β3 at 1 ng/ml for depicted time. Cell extracts were used in Western blotting to measure the levels of p21. (F) Control (Con) and DNRII HMECs were transiently cotransfected with a β-gal expression plasmid and a p53-responsive p21 promoter-luciferase (Luc) or PCNA promoter-Luc plasmid. The transfected cells were then treated without or with Mit C at 5 μg/ml for 21 h. Luciferase activity was normalized with β-gal activity, and the relative luciferase activity of each cell line without Mit C treatment was converted to one unit to allow statistical comparison across all groups. (G) Control, DNRII, and DNRII + Ras cells were treated without or with Mit C as in F. The chromatin was cross-linked and immunoprecipitated with a p53 antibody as described in Materials and Methods. The amount of p53 binding sequences in p21 and MDM2 promoters in the input control and precipitated with the anti-p53 antibody was measured with qPCR. AChR promoter was used as a negative control. The percentage total promoter occupancy of each cell line without Mit C treatment was converted to one unit for statistical comparison across all groups. Each value is the mean ± SEM from three transfections for F or three qPCR for E. The bars bearing a different letter are significantly different at p < 0.05 detected with one-way ANOVA.
FIGURE 7:
FIGURE 7:
A high level of p21 expression is necessary for H-Ras-V12–induced SLGA. (A) HMECs were infected with H-Ras-V12–containing retrovirus. After depicted days of Ras expression, the cells were harvested for Western blotting analysis of indicated gene expression. The cells exhibited SLGA after 6–8 d of Ras expression. (B) HMECs were infected with retrovirus containing a control (Con) or a p21 shRNA (p21sR). The stably infected cells were then infected with the H-Ras-V12–containing retrovirus. Western blotting analyses were performed to detect p21 expression in these cells. The bar figures under the Western blots are GAPDH-normalized p21 levels quantified with Image-Pro software (Media Cybernetics, Bethesda, MD). (C) Representative images of HMECs infected with control, p21 shRNA, and/or H-Ras-V12 retroviruses (100× magnification). The control cells expressing H-Ras-V12 were growth arrested and showed an enlarged, flattened senescent morphology, whereas p21 shRNA cells proliferated like control cells after H-Ras-V12 expression.

Similar articles

Cited by

References

    1. Adorno M, et al. A mutant-p53/Smad complex opposes p63 to empower TGFbeta-induced metastasis. Cell. 2009;137:87–98. - PubMed
    1. Bandyopadhyay A, Zhu Y, Cibull ML, Bao L, Chen C, Sun L. A soluble transforming growth factor beta type III receptor suppresses tumorigenicity and metastasis of human breast cancer MDA-MB-231 cells. Cancer Res. 1999;59:5041–5046. - PubMed
    1. Bartkova J, et al. DNA damage response as a candidate anti-cancer barrier in early human tumorigenesis. Nature. 2005;434:864–870. - PubMed
    1. Bierie B, Moses HL. TGF-beta and cancer. Cytokine Growth Factor Rev. 2006;17:29–40. - PubMed
    1. Bild AH, et al. Oncogenic pathway signatures in human cancers as a guide to targeted therapies. Nature. 2006;439:353–357. - PubMed

Publication types

MeSH terms