Comparative Study
. 2012 Apr 1;188(7):3294-306.
doi: 10.4049/jimmunol.1101111. Epub 2012 Feb 22.

2,3,7,8-tetrachlorodibenzo-p-dioxin induces transcriptional activity of the human polymorphic hs1,2 enhancer of the 3'Igh regulatory region

Affiliations
Comparative Study

2,3,7,8-tetrachlorodibenzo-p-dioxin induces transcriptional activity of the human polymorphic hs1,2 enhancer of the 3'Igh regulatory region

Tharu M Fernando et al. J Immunol. .

Abstract

2,3,7,8-tetrachlorodibenzo-p-dioxin (TCDD) is an environmental toxicant known to inhibit Ab secretion and Ig expression. Inhibition of Ig expression may be partially mediated through repression of the 3'Igh regulatory region (3'IghRR). TCDD inhibits mouse 3'IghRR activation and induces aryl hydrocarbon receptor binding to dioxin response elements within the 3'IghRR enhancers hs1,2 and hs4. The human hs1,2 enhancer (hu-hs1,2) is polymorphic as the result of the presence of one to four invariant sequences (ISs), which have been correlated with several autoimmune diseases. The IS also contains a dioxin response element core motif. Therefore, the objective was to determine whether hu-hs1,2 activity is sensitive to TCDD. Using a mouse B cell line (CH12.LX), we compared the effects of TCDD on mouse hs1,2 versus hu-hs1,2 activity. TCDD inhibited mouse hs1,2 similarly to the mouse 3'IghRR. In contrast, hu-hs1,2 was activated by TCDD, and antagonist studies supported an aryl hydrocarbon receptor-dependent activation, which was replicated in a human B cell line (IM-9). Absence of Pax5 binding sites is a major difference between the human and mouse hs1,2 sequence. Insertion of the high-affinity Pax5 site in hu-hs1,2 markedly blunted reporter activity but did not alter TCDD's effect (i.e., no shift from activation to inhibition). Additionally, deletional analysis demonstrated a significant IS contribution to hu-hs1,2 basal activity, but TCDD-induced activity was not strictly IS number dependent. Taken together, our results suggest that hu-hs1,2 is a significant target of TCDD and support species differences in hs1,2 regulation. Therefore, sensitivity of hu-hs1,2 to chemical-induced modulation may influence the occurrence and/or severity of human diseases associated with hu-hs1,2.


Figures

FIGURE 1
FIGURE 1. Schematic of the human and mouse Igh locus
A, Schematic of the rearranged human and mouse Igh gene locus including the variable (VDJ) and constant regions and the transcriptional regulators: variable heavy chain promoter (VH), intronic enhancer (Eµ), germline promoters upstream of each constant region (open rectangles), and the enhancers of the 3’Igh regulatory region(s). B, Alignment of human and mouse hs1,2 enhancers (EMBL AF013723 and X96607; 34, 69) with predicted transcription factor binding sites. C, Sequence analysis of the human hs1,2 reporters for the human hs1,2 alleles (α1A, α1B, and α1C). Similar to previous sequence analysis (EMBL AJ298015, AJ298016, AJ298017 for α1A, α1B, and α1C, respectively; 29), transcription factor binding sites (Sp1, DRE, AP-1, NF1, NF-κB) have been identified (represented by increased font size with italicizing and/or bolding). The polymorphic region containing varying repeats of the invariant sequence is underlined. Human samples (buccal cells) were also analyzed for the polymorphic hs1,2 enhancer. Following allelic assignment, human samples were sequenced (several individual samples for α1A and α1B; one for α1C due to low frequency) and compared to the reporter plasmids. Asterisks (*) denote differences between the human samples and reporter. The Sp1 and DRE binding sites in parentheses for the α1C plasmid were not conserved; however these binding sites were conserved in the α1C human sample.
FIGURE 2
FIGURE 2. TCDD inhibits LPS-induced mo-hs1,2 enhancer activity
A, CH12.LX cells were transiently transfected with the mo-hs1,2 reporter plasmid. Cells were either cultured for 24 h with media alone (NA, naive) or with varying concentrations of TCDD (0 – 10.0 nM) in the presence of LPS (1.0 µg/mL) stimulation. Luciferase enzyme activity (mean ± SEM, n=3) is represented on the y-axis as relative light units (RLUs). B, CH12.γ2b-hs3A/hs1,2 cells which express a γ2b transgene under the regulation of the hs3A/hs1,2 enhancer pair were either cultured for 48 h in media alone (NA) or treated with various concentrations of TCDD (0 – 10.0 nM) in the presence of LPS (1.0 µg/mL) stimulation. γ2b protein expression (mean ± SEM, n=3) in the cell lysate was determined by sandwich ELISA and standardized to ng/1 µg of total protein as shown on the y-axis. “C” denotes LPS stimulation alone. Significance was determined by a 1-way ANOVA followed by a Dunnett’s post-hoc test: “**”, significance from the corresponding vehicle control (0.01% DMSO, denoted 0 nM TCDD) at p<0.01. Results are representative of at least three independent experiments.
FIGURE 3
FIGURE 3. TCDD inhibits endogenous Ig heavy- and light-chain genes
CH12.LX cells (2.5 × 10⁴ cells/mL) stimulated with LPS and treated with 10 nM TCDD or the vehicle control (0.01% DMSO, denoted 0 nM TCDD) were plated into 12-well plates and incubated for 24, 36, or 48 h prior to total RNA isolation. Total RNA (200 ng) was reverse transcribed to cDNA and utilized to amplify the endogenous heavy- and light-chain genes (Cα and Cκ respectively) via SYBR®Green real-time PCR. The results are expressed as the relative quantification (RQ) value compared to cells cultured with media alone (NA, naive). Results are representative of three separate experiments (n=3 for each treatment group). Statistical differences compared to the respective vehicle control were determined by a 1-way ANOVA with a Dunnett’s post-hoc test; ** P < 0.01 or *** P<0.001.
FIGURE 4
FIGURE 4. TCDD activates the polymorphic hu-hs1,2 enhancer in a concentration-dependent manner
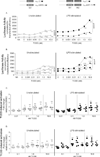
A, Schematic of human VH promoter alone and α1 hs1,2 allelic constructs containing the invariant sequence (IS, denoted by a star). All luciferase reporter plasmids originated from the pGL3 Basic vector (Promega) and the polymorphic α1 hu-hs1,2 enhancers were inserted 3’ of the luciferase gene. B and C, CH12.LX cells were transiently transfected with VH, α1A, α1B, or α1C reporter constructs. Transfected cells were cultured for 24 h with either media alone (NA, naïve) or with varying concentrations of TCDD (0 – 10.0 nM) in the absence or presence of LPS (1.0 µg/mL) stimulation. B, Luciferase enzyme activity (mean ± SEM, n=3) is represented on the y-axis as relative light units (RLUs) normalized to transfection efficiency and relative to the naïve control (set to 1 RLU) of the VH reporter. “C” denotes LPS stimulation alone. “>” denotes a synergistic activation by a TCDD and LPS co-treatment compared to the activation induced by either treatment alone. LPS-stimulated samples were significantly (at least p<0.01) elevated compared to their corresponding unstimulated samples as determined by a 1-way ANOVA followed by a Bonferroni’s post-hoc test (not represented on graph). Results are representative of three separate experiments. C, TCDD-induced activation is represented on the y-axis as fold-change relative to the respective vehicle control (0.01% DMSO, 0.0 nM TCDD) and was generated from 3 to 11 separate experiments; each symbol (square, triangle, inverted triangle, and diamond signify the VH, α1A, α1B, and α1C reporter constructs, respectively) represents the mean (n=3) from a single experiment. Significance compared to either the corresponding vehicle control (0.01% DMSO, denoted 0 nM TCDD) (B) or the respective VH reporter (C) was determined by a 1-way ANOVA followed by a Dunnett’s post-hoc test: “*”, “**”, significance at p<0.05 and p<0.01, respectively.
FIGURE 5
FIGURE 5. LPS modulates TCDD-induced activation of the polymorphic hu-hs1,2 enhancer in a concentration-dependent manner
CH12.LX cells were transiently transfected with VH, α1A, α1B, or α1C reporter constructs. Transfected cells were cultured for 24 h with either media alone (0 µg/mL LPS control) or with varying concentrations of LPS (0.001 – 1.0 µg/mL) in the absence (denoted “Control”) or presence of 0.01% DMSO or 10 nM TCDD. A, Luciferase enzyme activity (mean ± SEM, n=3) is represented on the y-axis as relative light units (RLUs) normalized to transfection efficiency and relative to the naïve control (set to 1 RLU) of the VH reporter. “>” denotes a synergistic activation by a TCDD and LPS co-treatment compared to the activation induced by either treatment alone. Results are representative of three separate experiments. B, TCDD-induced activation is represented on the y-axis as fold-change relative to the respective DMSO vehicle control and was generated from three separate experiments; each symbol (square, triangle, inverted triangle, and diamond signify the VH, α1A, α1B, and α1C reporter constructs, respectively) represents the mean (n=3) from a single experiment. Significance was determined by a 1-way ANOVA followed by a Dunnett’s post-hoc test. A, “*” and “**”, significance from the corresponding DMSO vehicle control at p<0.05 and p<0.01, respectively; “†”, “††”, significance from the corresponding naïve control (0 µg/mL LPS) at p<0.05, p<0.01, respectively. B, “*”, significance compared to the respective VH reporter at p<0.05.
FIGURE 6
FIGURE 6. TCDD activates the polymorphic hu-hs1,2 enhancer in the human IM-9 B-cell Line
IM-9 cells were transiently transfected with VH, α1A, α1B, or α1C reporter constructs. Transfected cells were cultured for 24 h with either media alone (denoted “Control”), 0.01% DMSO or 30 nM TCDD. A, Luciferase enzyme activity (mean ± SEM, n=3) is represented on the y-axis as relative light units (RLUs) normalized to transfection efficiency. Significance was determined by a 2-way ANOVA followed by a Bonferroni’s post-hoc test: “**” and “***”, significance compared to the corresponding DMSO vehicle control at p<0.01 and p<0.001, respectively; significance of polymorphic hu-hs1,2 reporters compared to the VH reporter at p<0.05 for α1A and p<0.001 for α1B and α1C (not represented on the graph). Results are representative of three separate experiments. B, TCDD-induced fold-changes in reporter activity is represented on the y-axis as fold-change relative to the respective DMSO vehicle control and was generated from six to 12 separate experiments; each symbol represents the mean (n=3) from a single experiment. Significance compared to the VH reporter was determined by a 1-way ANOVA followed by a Dunnett’s post-hoc test: “*” and “**”, significance at p<0.05 and p<0.01, respectively.
FIGURE 7
FIGURE 7. Deletion of the IS from the α1A and α1B hu-hs1,2 constructs reduces overall reporter activity
CH12.LX cells were transiently transfected with reporter constructs regulated by either the wild-type α1A (square), α1A with the IS deleted (α1AΔIS1, triangle), wild-type α1B (diamond), or α1B with the 5’ IS deleted (α1BΔIS1, inverted triangle). Transfected cells were cultured for 24 h with either media alone (NA, naïve) or with varying concentrations of TCDD (0 – 10.0 nM) in the absence (white symbols) or presence (black symbols) of LPS (1.0 µg/mL) stimulation. “C” denotes LPS stimulation alone. A and B, Luciferase enzyme activity (mean ± SEM, n=3) of α1A and α1AΔIS1 (A) or of α1A, α1B, and α1BΔIS1 (B) is represented on the y-axis as relative light units (RLUs) normalized to transfection efficiency. Results are representative of at least five separate experiments. C and D, TCDD-induced activation of α1A and α1AΔIS1 (C) or of α1A, α1B, and α1BΔIS1 (D) is represented on the y-axis as fold-change relative to the respective DMSO vehicle control and was generated from five to seven separate experiments; each symbol represents the mean (n=3) from a single experiment. A–D, Significance compared to the corresponding vehicle control (0.01% DMSO, 0 nM TCDD) was determined by a 1-way ANOVA followed by a Dunnett’s post-hoc test: “*” and “**”, significance at p<0.05 and p<0.01, respectively. Significance between the reporters was determined by a 2-way ANOVA followed by a Bonferroni’s post-hoc test: A and B, the horizontal line represents significant differences (p<0.001) between two reporters at all treatment conditions; “††” and “†††”, significance between α1B, and α1BΔIS1 at p<0.01 and p<0.001, respectively. B and C, the reporters were not significantly different.
FIGURE 8
FIGURE 8. TCDD activates the polymorphic hu-hs1,2 enhancer in an AhR-dependent Manner
CH12.LX or IM-9 cells were transiently transfected with VH, α1A, α1B, or α1C reporter constructs. Transfected cells were either pre-treated with 15 µM AhR antagonist (CH-223191), 0.15% DMSO, or media alone then cultured for 24 h in the absence or presence of LPS (1.0 µg/mL) stimulation and either media alone, 0.01% DMSO, or TCDD (1 nM for CH12.LX; 30 nM for IM-9). The final DMSO concentration was 0.16%. “Control” denotes either unstimulated naive or LPS alone. A, Luciferase enzyme activity (mean ± SEM, n=3) in CH12.LX cells is represented on the y-axis as relative light units (RLUs) normalized to transfection efficiency. Results are representative of three separate experiments. B, TCDD-induced fold-changes in reporter activity in CH12.LX cells is represented on the y-axis as fold-change relative to the respective DMSO vehicle control and was generated from averaging the means of three independent experiments (n=3 for each treatment group within each experiment). C, TCDD-induced fold-changes in reporter activity in IM-9 cells is represented on the y-axis as fold-change (mean ± SEM, n=3) relative to the respective DMSO vehicle control and is representative of three experiments. Significance was determined by a 1-way ANOVA followed by a Dunnett’s post-hoc test (A) or 2-way ANOVA followed by a Bonferroni’s post-hoc test (B and C): “*”, “**”, “***”, significance compared to the corresponding DMSO vehicle control at p<0.05, p<0.01 and p<0.001, respectively; “‡”, “‡‡”, “‡‡‡”, significant difference between TCDD alone and TCDD + AhR antagonist. Significance compared to the VH reporter was determined by a 2-way ANOVA with a Bonferroni’s post-hoc test: “†”,“††”, and “†††”, significance at p<0.05, p<0.01 and p<0.001, respectively (A–C).
FIGURE 9
FIGURE 9. Insertion of a Pax5 binding site in the α1A hs1,2 construct inhibits reporter activity in mouse CH12.LX and human IM-9 cells
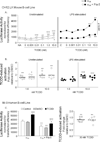
CH12.LX or IM-9 cells were transiently transfected with either wild type α1A (square) or α1A with an inserted high affinity Pax5 binding site from the mo-hs1,2 enhancer (α1A+Pax5, circle). A and B, Transfected CH12.LX cells were cultured for 24 h with varying concentrations of TCDD (0 – 10.0 nM) in the absence (white symbols) or presence (black symbols) of LPS (1.0 µg/mL) stimulation. C, Transfected IM-9 cells were cultured for 24 h with either media alone (denoted “Control”), 0.01% DMSO, or 30 nM TCDD. A and C (left graph), Luciferase enzyme activity (mean ± SEM, n=3) of α1A and α1A+Pax5 is represented on the y-axis as relative light units (RLUs) normalized to transfection efficiency. Results are representative of five (A) and seven (C, left graph) separate experiments. B and C (right graph), TCDD-induced activation of α1A and α1A+Pax5 is represented on the y-axis as fold-change relative to the respective DMSO vehicle control and was generated from five (B) and seven (C, right graph) separate experiments; each symbol represents the mean (n=3) from a single experiment. Significance compared to the corresponding vehicle control (0.01% DMSO, 0 nM TCDD) was determined by a 1-way ANOVA followed by a Dunnett’s post-hoc test (A) or 2-way ANOVA followed by a Bonferroni’s post-hoc test (B and C): “*”, “**”, “***”, significance compared to the corresponding DMSO vehicle control at pα0.05, p<0.01, and p<0.001, respectively. Significance between the α1A and α1A+Pax5 reporters was determined by a 2-way ANOVA followed by a Bonferroni’s post-hoc test: A, horizontal line represents significant differences (p<0.001) at all treatment conditions; A and C (left graph), “†”, “††”, “†††”, significance at p<0.01, p<0.05, and p<0.001, respectively; B, no significant difference between the α1A and α1A+Pax5 reporters. C (right panel), TCDD-induced fold-changes of α1A and α1A+Pax5 were not significantly different as determined by an unpaired t-test.

Similar articles

Cited by

References

    1. Lieberson R, Ong J, Shi X, Eckhardt LA. Immunoglobulin gene transcription ceases upon deletion of a distant enhancer. EMBO J. 1995;14:6229–6238. - PMC - PubMed
    1. Pinaud E, Khamlichi AA, Le Morvan C, Drouet M, Nalesso V, Le Bert M, Cogne M. Localization of the 3' IgH locus elements that effect long-distance regulation of class switch recombination. Immunity. 2001;15:187–199. - PubMed
    1. Vincent-Fabert C, Fiancette R, Pinaud E, Truffinet V, Cogne N, Cogne M, Denizot Y. Genomic deletion of the whole IgH 3' regulatory region (hs3a, hs1,2, hs3b, hs4) dramatically affects class switch recombination and Ig secretion to all isotypes. Blood. 2010;116:1895–1898. - PubMed
    1. Sulentic CEW, Holsapple MP, Kaminski NE. Putative link between transcriptional regulation of IgM expression by 2,3,7,8-tetrachlorodibenzo-p-dioxin and the aryl hydrocarbon receptor/dioxin-responsive enhancer signaling pathway. J. Pharmacol. Exp. Ther. 2000;295:705–716. - PubMed
    1. Sulentic CEW, Kang JS, Na YJ, Kaminski NE. Interactions at a dioxin responsive element (DRE) and an overlapping kappaB site within the hs4 domain of the 3'alpha immunoglobulin heavy chain enhancer. Toxicology. 2004;200:235–246. - PubMed

Publication types

MeSH terms

Substances