. 2012 May;107(10):2756-68.
doi: 10.1152/jn.01072.2011. Epub 2012 Feb 22.

Passive resting state and history of antagonist muscle activity shape active extensions in an insect limb

Affiliations

Passive resting state and history of antagonist muscle activity shape active extensions in an insect limb

Jan M Ache et al. J Neurophysiol. 2012 May.

Abstract

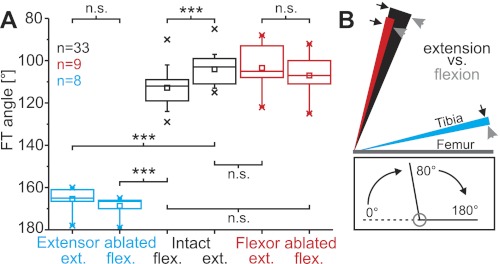
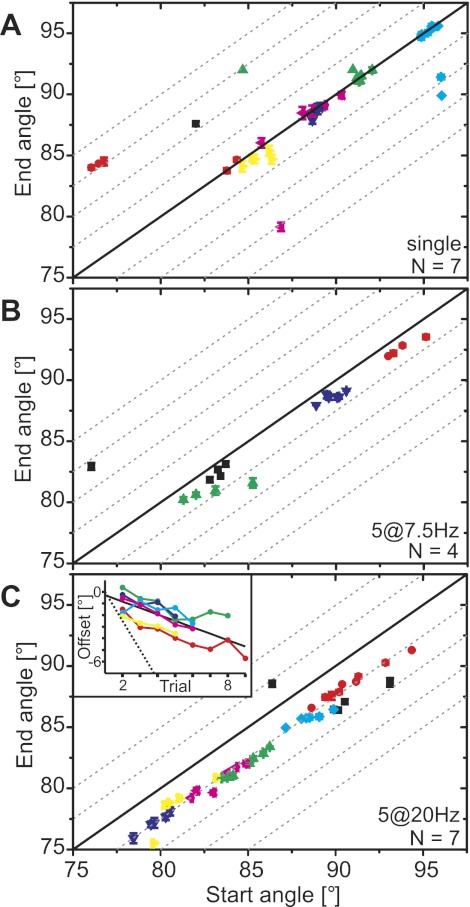
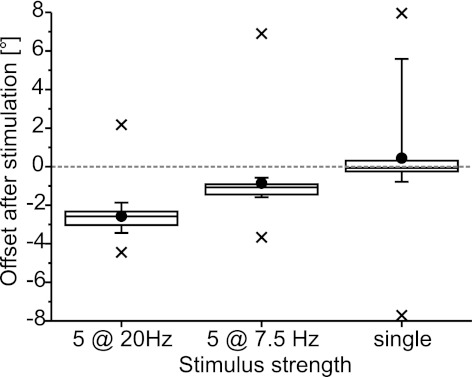
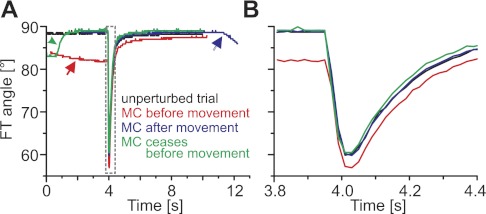
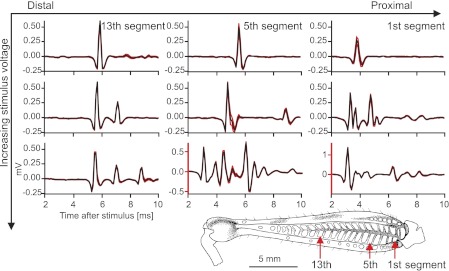
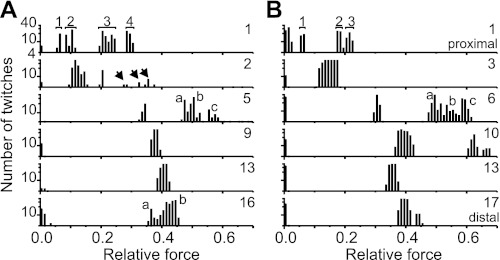
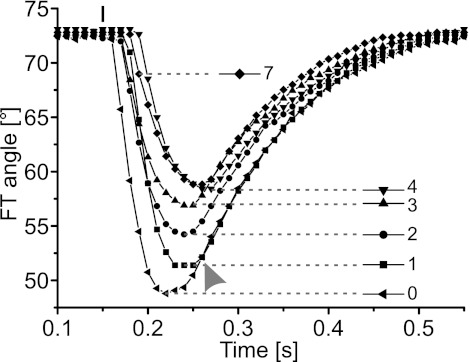
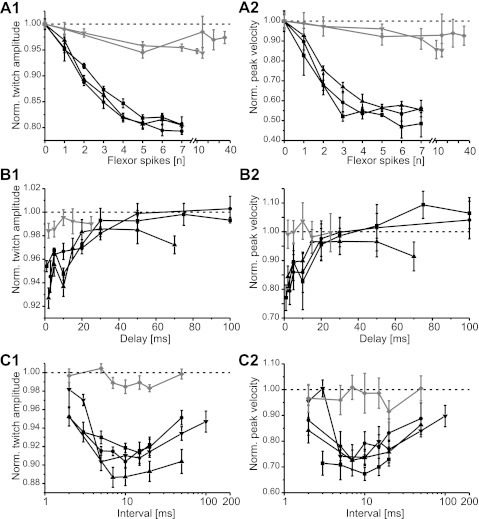
Limb movements can be driven by muscle contractions, external forces, or intrinsic passive forces. For lightweight limbs like those of insects or small vertebrates, passive forces can be large enough to overcome the effects of gravity and may even generate limb movements in the absence of active muscle contractions. Understanding the sources and actions of such forces is therefore important in understanding motor control. We describe passive properties of the femur-tibia joint of the locust hind leg. The resting angle is determined primarily by passive properties of the relatively large extensor tibiae muscle and is influenced by the history of activation of the fast extensor tibiae motor neuron. The resting angle is therefore better described as a history-dependent resting state. We selectively stimulated different flexor tibiae motor neurons to generate a range of isometric contractions of the flexor tibiae muscle and then stimulated the fast extensor tibiae motor neuron to elicit active tibial extensions. Residual forces in the flexor muscle have only a small effect on subsequent active extensions, but the effect is larger for distal than for proximal flexor motor neurons and varies with the strength of flexor activation. We conclude that passive properties of a lightweight limb make substantial and complex contributions to the resting state of the limb that must be taken into account in the patterning of neuronal control signals driving its active movements. Low variability in the effects of the passive forces may permit the nervous system to accurately predict their contributions to behavior.


Figures

Fig. 1.
Fig. 1.
A: the hind leg femorotibial (FT) resting angle of intact legs (black) was significantly more flexed after release from full flexion (intact flexed) than after release from full extension (intact extended). Ablation of the extensor tibiae muscle led to a significant increase of the resting angle (tibial flexion) following release from either full extension or full flexion (blue), whereas ablation of the flexor muscle had no significant effect (red). The boxes indicate the quartiles; whiskers show the 90 and 10 percentiles, respectively; crosses indicate minima and maxima of the distributions; and squares show the respective mean angle. Ext., extended; flex., flexed; n.s., not significant. ***P < 0.001. B: the history dependence of the FT resting angle. The inner border of each colored area (arrowheads) represents the posture of the tibia after release from full flexion, and the outer border (arrows) represents the posture after full extension (mean positions). The difference between these angles (areas of solid color) therefore indicates the history dependency of the resting angle. Black, red, and blue correspond to the same-colored experimental conditions as in A. Lines representing the tibiae are drawn with different lengths for clarity of illustration; n = no. of legs for A and B, N = 17 animals: 10 solitarious, 7 gregarious, data pooled. Inset shows the angle conventions used throughout this report.
Fig. 2.
Fig. 2.
Resting angle (start angle) prior to an active movement generated by stimulation of the fast extensor tibiae motor neuron (FETi) predicts reliably the resting angle reached 10 s after the movement (end angle). A: the end angle was equal to the start angle for single twitches. Data from N = 7 different animals are shown in different colors. Symbols show means ± SD of single trials; the angles were averaged over 5 frames. In most cases the SD is smaller than the symbol size. Dashed gray lines indicate offsets in steps of 2.5° from the solid black line, which indicates end angle = start angle. Trials in A: 42, n = 5–10. There are 16 partially overlaid data points falling between starting angles of 88° and 90°, including 4 from 1 animal (black). B: the end angle depended directly on the start angle and had an offset of approximately −1° after movements generated by stimulation at 7.5 Hz. Trials in B: 19, n = 4–5. C: the end angle depended directly on the start angle and had an offset of approximately −2.5° after movements generated by stimulation at 20 Hz. Trials in C: 44, n = 5–9. Inset: repeated stimulation of FETi shifts the resting angle to more extended angles. The start angle of the first trial was subtracted from all trials such that the data indicate the offset of the start angle with respect to the first trial. The trial number had a significant effect on the resting angle (solid black line: Y = −0.55X − 0.29, R = −0.783, P < 0.001). The linear fit was applied to all individual trials of all animals. The dotted black line follows Y = −2.5 × (trial − 1) and thus gives the relation expected if the end angle of one trial was the start angle of the following trial. The data set shown in black in C was excluded from the inset because the first trial was an outlier.
Fig. 3.
Fig. 3.
Strength of stimulation of FETi influenced the offset of the resting angle. The data for all stimuli were pooled across all animals; sample sizes are as given in Fig. 2. Negative values indicate more extended angles. The boxes indicate the quartiles; filled circles show the mean offset; whiskers indicate 10% and 90% intervals; and crosses indicate minimum and maximum values. The offset increased with the number of pulses applied, as shown by the difference between the offset after single-pulse stimulation and the other 2 stimulus types, in which 5 spikes were elicited in the FETi motor neuron. The offset also increased with increasing stimulus frequency, which manifests in the difference in offset after 7.5- and 20-Hz stimulation. These effects were significant (1-way repeated-measures ANOVA, P = 4 × 10⁻⁷, Tukey's test: all P values <0.002).
Fig. 4.
Fig. 4.
Active movements (rapid downward deflections at 4 s) were modified by slower sporadic myogenic contractions (MC). A: the 4 traces show movements of the same tibia, each driven by a single spike in the FETi motor neuron. One of the movements was unperturbed (black), one was elicited during an ongoing MC (red line, red arrow indicates the MC), one was followed by an MC (blue line and arrow), and one was preceded by an MC (green line, green arrowhead indicates the passive return following the myogenic contraction). MCs were slower and of lower amplitude than either FETi-driven or passive movements. B: the active, FETi-driven extensions on an expanded timescale as indicated by the dashed gray box in A. The movement elicited during the ongoing MC (red line) had the largest overall amplitude.
Fig. 5.
Fig. 5.
Stimulation of more proximal flexor muscle bundles or using higher voltages evoked more motor neuron spikes than did distal or lower voltage stimulation. The curves show the mean (black) ± SE (red) antidromic spike waveform recorded from nerve 5 in the thorax. The flexor tibiae muscle was stimulated at different positions, which are annotated by reference to the closest extensor tibiae muscle bundle in the top row (see inset illustration of femur). Each column represents recordings of potentials evoked at the same stimulus site at 3 different stimulus amplitudes. The top row corresponds to stimuli just above threshold to elicit twitches; the middle row corresponds to trials with stimuli of medium voltage; and the bottom row to trials with stimuli at high stimulus voltages. The goal of these experiments was to sequentially recruit different motor neurons: the absolute or relative levels of stimulation required to do so are not important for the analyses. n = 20 or 21 sweeps were used per average. Note that the bottom center and right recordings are scaled differently from all other recordings (red axes). All data are from 1 continuous experiment.
Fig. 6.
Fig. 6.
Different sets of motor neurons could be stimulated at different sites in the flexor tibiae muscle. A and B show data from 2 different animals; data in A were recorded from the same animal as that used for Fig. 5. The stimulus site used for each set of trials is indicated by the number at top right of each row, as described in the legend to Fig. 5. The numbers of twitches with a particular force X were counted and binned for each stimulus position, independently of the stimulus voltage used to elicit them, so all motor units that could be stimulated at each position were included. Force is comparable within but not directly between animals. All of the Y-axes are log-scaled and span 4–40 as shown at top left. Each number in the top row indicates a force peak generated by 1 particular set of neurons. Arrows in the second row in A mark a set of medium-force peaks. The letters a, b, and c in the third row mark 3 distinct force peaks generated that were similar in both animals (A and B). a and b in the bottom row in A mark 2 distinct peaks in the force distribution. Very low amplitude forces (<0.05 relative force) reflect noise in the measurement.
Fig. 7.
Fig. 7.
Contractions of the flexor tibiae muscle modified subsequent active extensions of the tibia generated by stimulation of FETi. The amplitude of the extension movement decreased with increasing strength of flexor stimulation: the onset of movement was increasingly delayed, and the movements were slower. Each curve shows the time course of a single active extension movement after the flexor tibiae was stimulated with a different number of spikes (see key). The small vertical bar at top indicates the point of extensor stimulation. When multiple stimuli were applied to the flexor tibiae muscle, the interval between pulses was 10 ms. The delay between the last flexor tibiae stimulus and extensor stimulation was constant at 10 ms. Flexor stimulation was isometric, so the starting angle for subsequent isotonic extension movements was constant. The passive return movements after pure extensor stimulation and extensor stimulation following a single flexor spike were similar (gray arrowhead). Prior stimulation of the flexor tibiae muscle with 4 and 7 spikes resulted in similar extension movements.
Fig. 8.
Fig. 8.
Velocity and amplitude of active extensions change with the number of preceding spikes in flexor tibiae motor neurons (A), the delay between flexor and extensor tibiae activation (B), and the rate of preceding flexor motor neuron stimulation (C). Left column shows the amplitude, and right column shows the peak velocity, of active extension movements following isometric flexor tibiae contractions. The extension twitch amplitude and peak velocity were normalized by the mean values of the 2 measures for trials without flexor tibiae activation for each animal. Black symbols show results for stimulation of distal flexor tibiae motor neurons (N = 3–4 animals; n = 4–7 trials); gray symbols show results for proximal stimulation (N = 1–2 animals; n = 4–7 trials). Note that the X-axis is broken in A and log-scaled in C. Norm., normalized.

Similar articles

Cited by

References

    1. Ache JM. From Spike to Movement—Biomechanics and Passive Forces in an Insect Joint (MSc thesis). Cologne, Germany: University of Cologne, 2010
    1. Ahn AN, Full RJ. A motor and a brake: two leg extensor muscles acting at the same joint manage energy differently in a running insect. J Exp Biol 205: 379–389, 2002 - PubMed
    1. Ball EE, Goodman CS. Muscle development in the grasshopper embryo. II. Syncytial origin of the extensor tibiae muscle pioneers. Dev Biol 111: 399–416, 1985a - PubMed
    1. Ball EE, Goodman CS. Muscle development in the grasshopper embryo. III. Sequential origin of the flexor tibiae muscle pioneers. Dev Biol 111: 417–424, 1985b - PubMed
    1. Bässler D, Büschges A, Meditz S, Bässler U. Correlation between muscle structure and filter characteristics of the muscle-joint system in three orthopteran insect species. J Exp Biol 199: 2169–2183, 1996 - PubMed

Publication types

LinkOut - more resources